
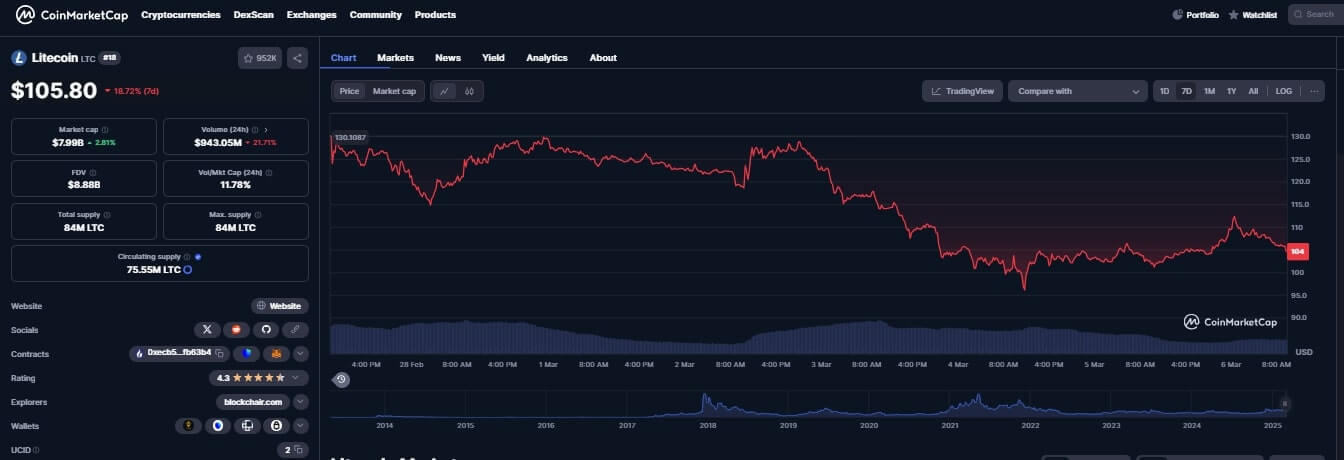
Litecoin is down by more than 18% in the last 7 days thanks to the resurgence of Trump tariffs against neighbors. However, even as the rest of the top coins posted significant gains, LTC dragged on as it failed to break above $110.
Litecoin is up by 2% today, March. 7, to reach $106. The subtle rebound, however, hasn’t done enough to help the top Bitcoin hard fork escape the bearish downtrend that has seen its prices crash by more than 18% in the last 7 days, even crashing below $100 and finding support around $95 at one point.
The fall from the high of $130 a week ago can be explained by the resurgence of Trump tariffs against Canada and Mexico.
Yesterday, Trump announced a pause on tariffs against motor vehicles – sparking hope in the crypto industry. Top coins, including Bitcoin and Ethereum, have reacted overwhelmingly positive to the news with the two coins recapturing the important psychological support levels of $91,000 and $2600, respectively.
Litecoin hasn’t been as enthusiastic about the tariff pause and has had a hard time climbing above $110.

Why Won’t Litecoin Recapture the $110 Price Level?
A number of factors have, over the last few days, played a key role in preventing Litecoin’s ascent back to $130 or a climb above the support, which has now turned resistance, level of $118.
The most impactful has been the bear-leaning market sentiment. Taking a look at the crypto market charts, you will notice that coins started bleeding massively in the third week of January, a few days before the FED meeting.
Before the market even recovered, Trump tariffs came into effect and threw the market into a tailspin. These events have spooked investors who rushed to book profits, triggering massive sell pressure for most coins.
This has not only wiped out most of the gains made by top crypto coins over the past six months but has also battered investor sentiment, even dragging the Crypto Fear & Greed Index below 10.
Litecoin’s Next Price Action
LTC will continue trading sideways with a slight inclination to further dips in the short term – if the technical indicators are anything to go by.
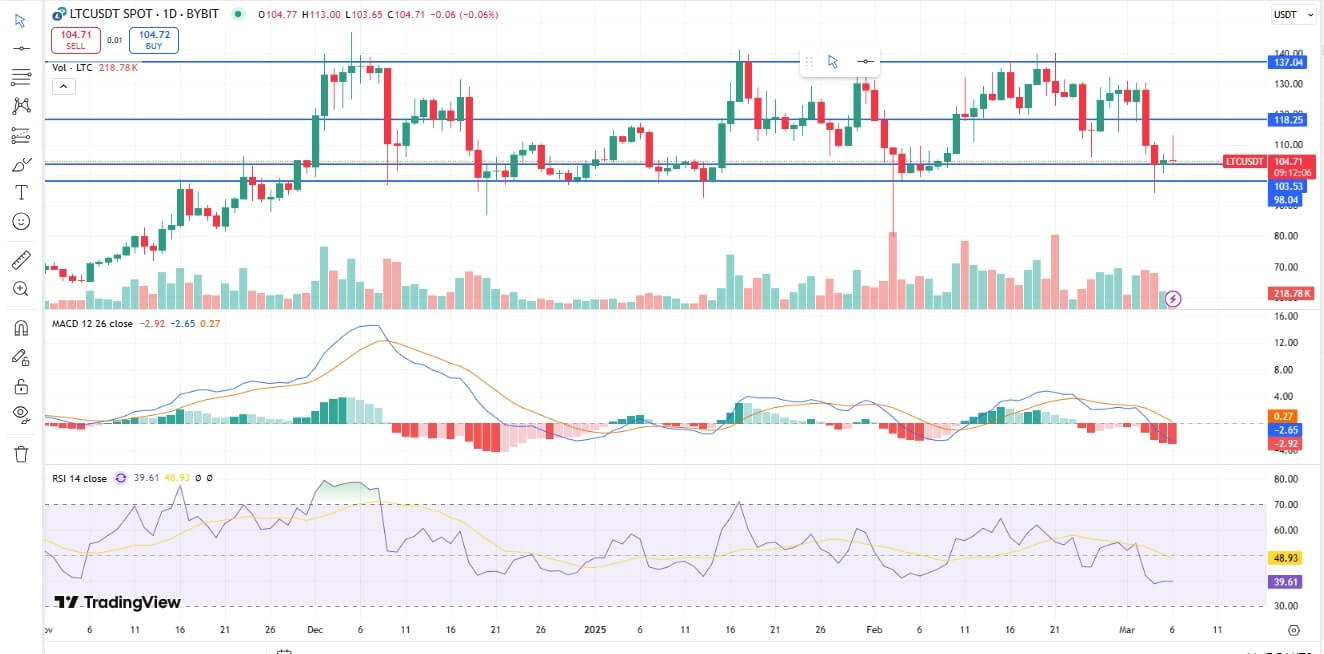
On the daily LTC/USD chart, for example, the MACD histogram prints red bars. The MACD line has also crossed the signal line from above and dived into the negative territory. Not to mention that its RSI has also dipped from the slightly bullish level of 55 at the beginning of the month to as low as 38 today.

🚀 Don’t Miss the Next Big Crypto Move!
Our premium members received real-time alerts on major crypto plays before they happened. Will you be ready for the next one?
🔴 Latest Insider Alerts:
- 📢Buy The Dip Is Here (Feb 28th)
- 📢How To Know Whether BTC Will Set A Bottom This Week? (Feb 25th)
- 📢This Token Is Set To Emerge As An Outperformer as USD Breaks Down. (Feb 16th)
- 📢When Will This Market Finally Start Moving? (Feb 9th)
- 📢Will February 5th Come To The Rescue? (Feb 4th)
⏳ Limited Spots Available – Secure Yours Now!


