It is just 6 weeks ago since the flash-crash of the crypto market. As documented in Crypocurrencies Falling With The Global Market Sell-off the strong sell-off primarily in the Nasdaq resulted in Bitcoin to sell-off, the very same day. The correlation between the Nasdaq and Bitcoin should not come as a surprise. However, as the Nasdaq sold-off multiple times since then we saw less impact on Bitcoin, even to the point yesterday that Bitcoin went slightly higher. This suggest that our forecast may be underway Why Bitcoin Will Start Trending In The Next 2 to 3 Weeks, and it would be fully in line with our Bitcoin forecast 2019.
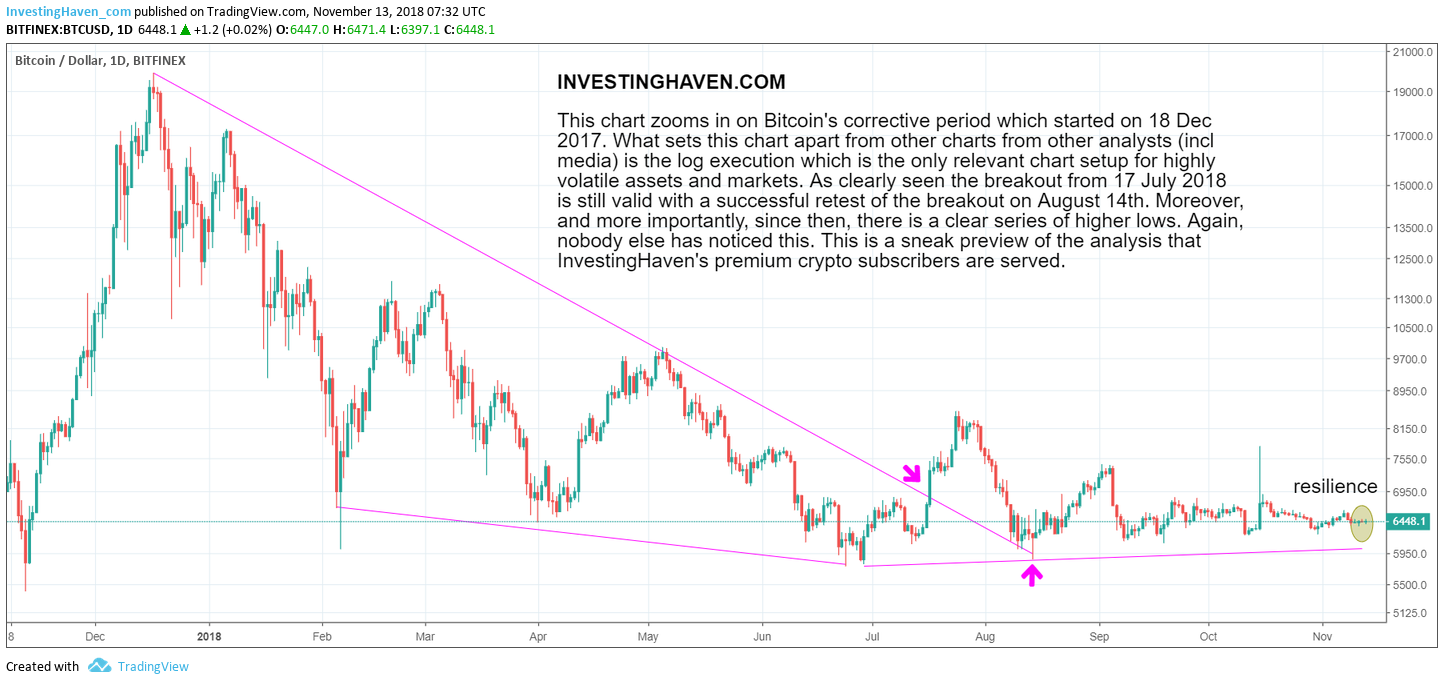
Just to get things straight one month ago InvestingHaven’s research team wrote: “We recommend watching the $6300 level closely as that’s the line in the sand between the two lower bands on Bitcoin’s long term chart seen below.” It still remains the most critical point on Bitcoin’s chart. Per our 1/99 investing principles it is just 1% of price points on a chart that have a relevant meaning to investors.
The price chart of Bitcoin says it all.
The resilience amid yesterday’s Nasdaq sell-off is highlighted with the yellow circle. The first sell-off on October 10th is visible with the red candle lower. Resilience since then is visible.
What all this means to us is that Bitcoin is preparing a move higher. We give this an 80 to 90 pct probability. If and once Bitcoin pushes above $7.5k which is a 15 pct move higher, it will set the first higher high, which, in chart terms, is incredibly powerful.
Note that we remain firmly convinced that Ripple’s XRP (XRP) will provide leverage on the price of Bitcoin because, as said on our article on Medium, Bitcoin futures are the fuel for the price of Ripple’s XRP token.


