In this article, we look at the SOL chart and compare it with the SOLBTC chart. The latter has much more accurate ‘buy the dip’ information for November 2024.
RELATED – Solana (SOL) Price Forecast 2025.
We start with the SOL chart, and then show the SOLBTC. Readers will immediately understand why SOLBTC gives so much more useful information, for SOL investors in November 2024 but also as ‘SOL buy the dip’ guidance.
SOL price analysis November 2024
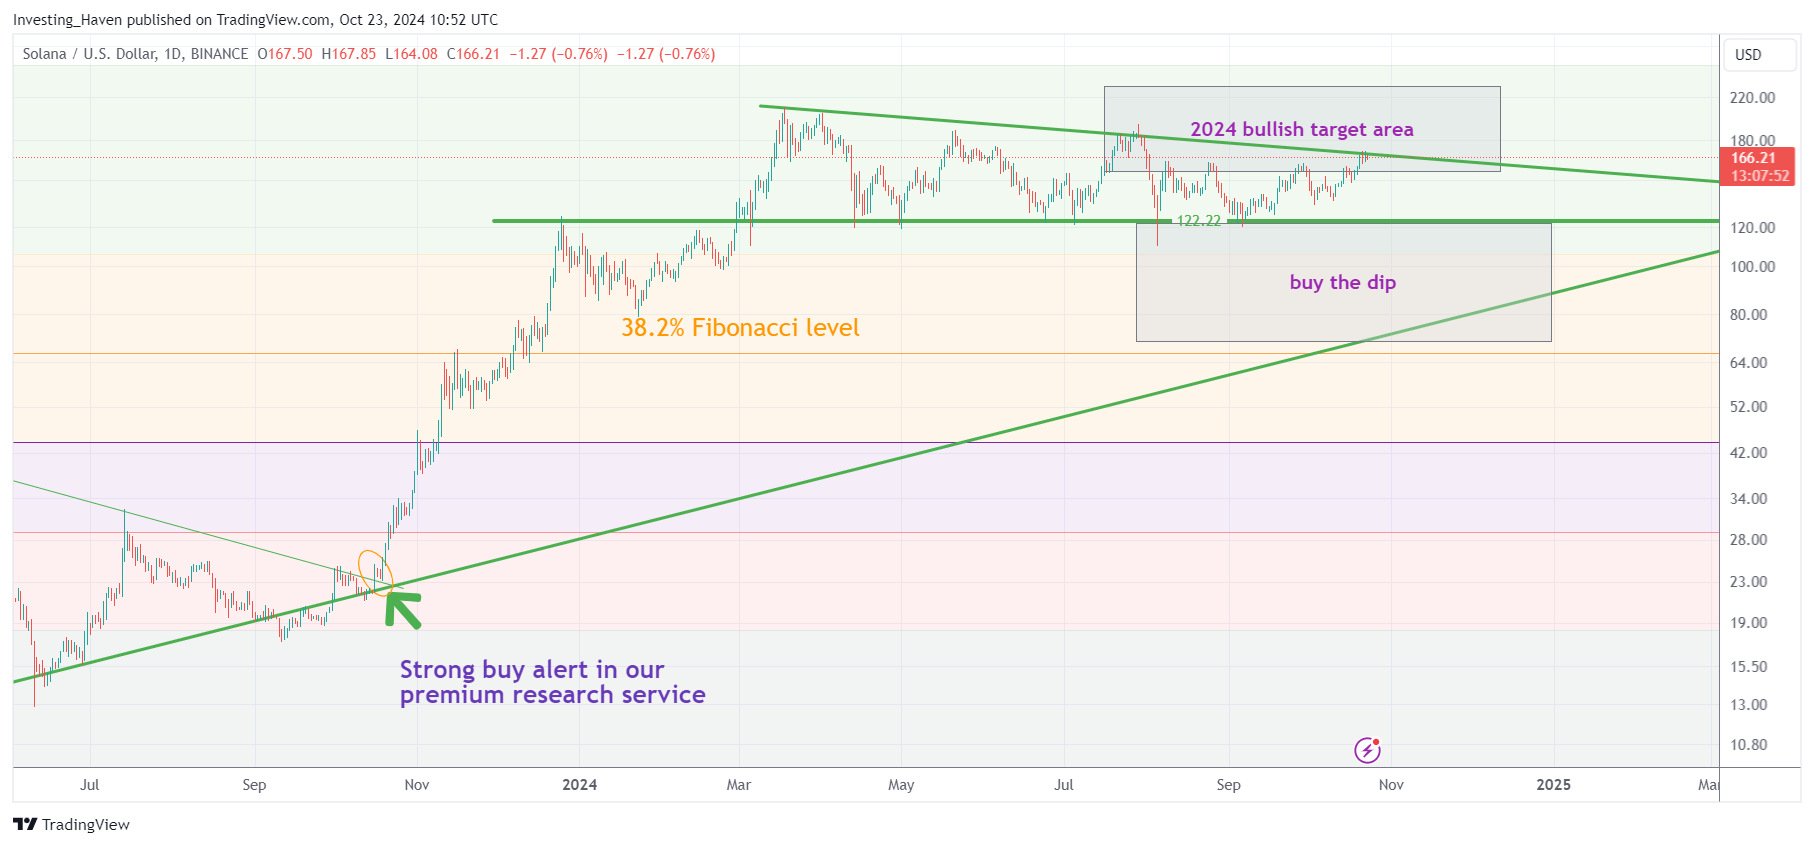
Below is the SOL price chart with key highlights as it relates to November 2024:
- SOL is consolidating since 6 months, in a relatively narrow range between $122 and $200.
- There is a bearish triangle in 2024 on the SOL chart – yes, it’s bearish until there is a bullish breakout to invalidate the currently bearish setup.
- There is a much more dominant trendline, rising, multi-year, that may override the 2024 bearish triangle.
The only question that truly matters is whether SOL will respect its rising multi-year trendline (presumably yes), and whether the current consolidation is short-term bearish but long-term bullish.
SOL might give the answer in November 2024, not later than January 2025, is how we read this chart setup.

SOL buy the dip guidance for 2024 & 2025
While the previous chart has a clear setup, the outcome is still dubious. That’s because there is a short-term bearish setup but it might be overridden by a long-term bullish pattern.
Clear but confusing.
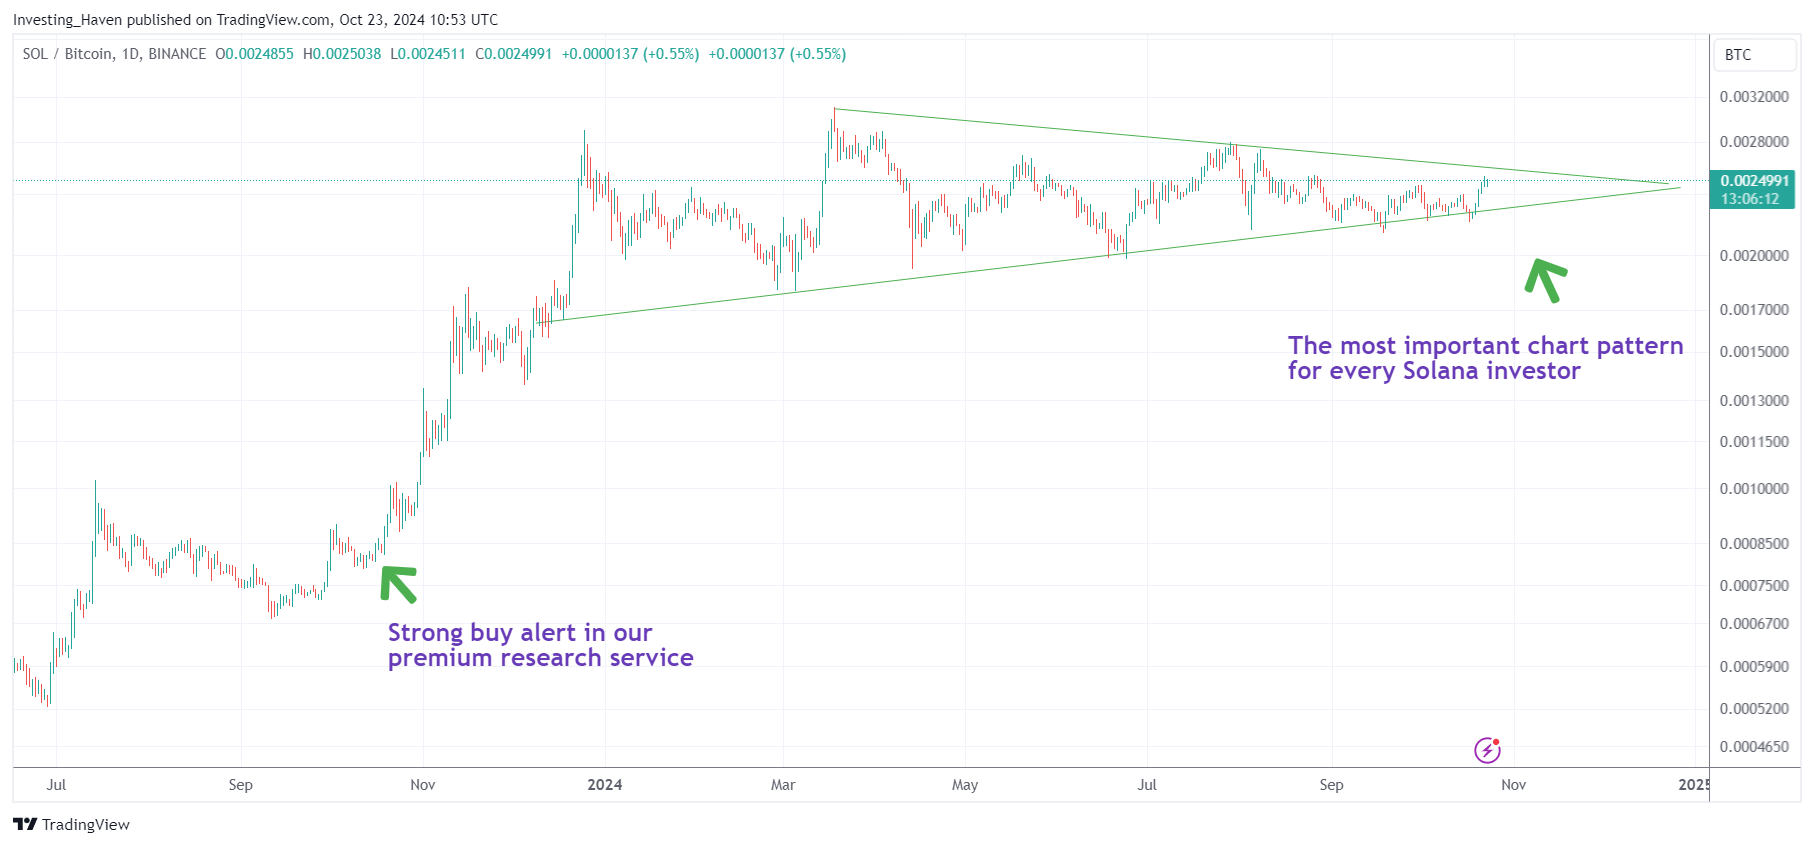
That’s why SOLBTC may come to the rescue.
Essentially, the SOLBTC chart has a much clearer setup – it’s a bullish triangle.
So, benefit of the doubt to the bulls.
As long as the bullish triangle holds, SOL will be working on a bullish consolidation!

SOL price charts that are misleading
It’s beyond imagination how little attention is given to the SOLBTC chart, especially since it brings so much clarity, offsetting the dubious SOLUSD chart.
Just have a look at a post like this one on X which is of course telling an exciting story. There is no charting analysis, no charting skills, no charting knowledge involved in this type of post.
WISDOM – We keep on warning our readers, serious investors, to stay away from exciting stories. The market is never transparent, it will do whatever it can to shake out the obvious outcome.
Never forget this when looking at this type of social media content:
SOLANA is going to $800
in the last Bullrun, it had 2 phases:
From $3 to $50 and from $25 to $250This time we went from $16 to $200
And going from $200 to $800 $SOL pic.twitter.com/vIUpVDbQ9y— CROW (@TheCrowtrades) October 21, 2024
SOL investing insights for November 2024
The SOL charts make it clear, and the take-aways for November 2024 are clear:
- SOLUSD – it’s a consolidation.
- SOLBTC – the bullish triangle is dominant for now.
- Buy the dip in November 2024? Only if the triangle on the SOLBTC chart holds!
While we like Solana, we believe there are much more ‘juicy’ opportunities in Solana’s ecosystem. We tipped 3 Solana ecosystem tokens in our 15 token tip list, sent to our premium crypto investing service members, just yesterday.


