With the Bitcoin price down on March 18th, 2025, and down over 14% month to date, it brings up the question what is happening. Relief might come in the form of a bull market later this month.
It’s no fun to see the price of Bitcoin drop 14% in the last month. What’s happening.
Here are the 2 reasons why the price of Bitcoin is dropping, and why crypto prices are down. Moreover, there is a psychological effect ($100k) at play combined with sentiment (overly bullish) which we explain as well.
RELATED – 15 crypto forecasts for 2025
Long term, we remain bullish as explained in our latest Bitcoin price prediction research. Short term, BTC is clearly vulnerable as the market can clearly see that $100,000 remains a tough to overcome level.
Is now a good time to buy Bitcoin (BTC)?
Now could be a great time to buy Bitcoin as it has come down from it’s all time highs of $108k and currently around $82k. Sentiment remains bullish so it could be an opportunity to buy the dip. But remain cautious as there is no guarantee it will not see a further retracement after the recent rally.
Bitcoin price down: It’s psychology and emotions
The price of Bitcoin hit a local top at $108k on January 15th, 2025.
Why do we emphasize the price and time?
Because it was not expected for BTC to clear $100k in a low momentum time period (January 2025).
In fact, it would have been surprising, very surprising, if BTC would continue moving higher in a low momentum period. That’s how we combine time and price analysis to understand when big moves may arise in crypto, both up and down, as per our proprietary methodology.
This is what we wrote in our premium research service, in the first week of January, when BTC was approaching $100k:
In terms of price, the most bullish outcome will be that BTC drops to $91.5k.
We also wrote:
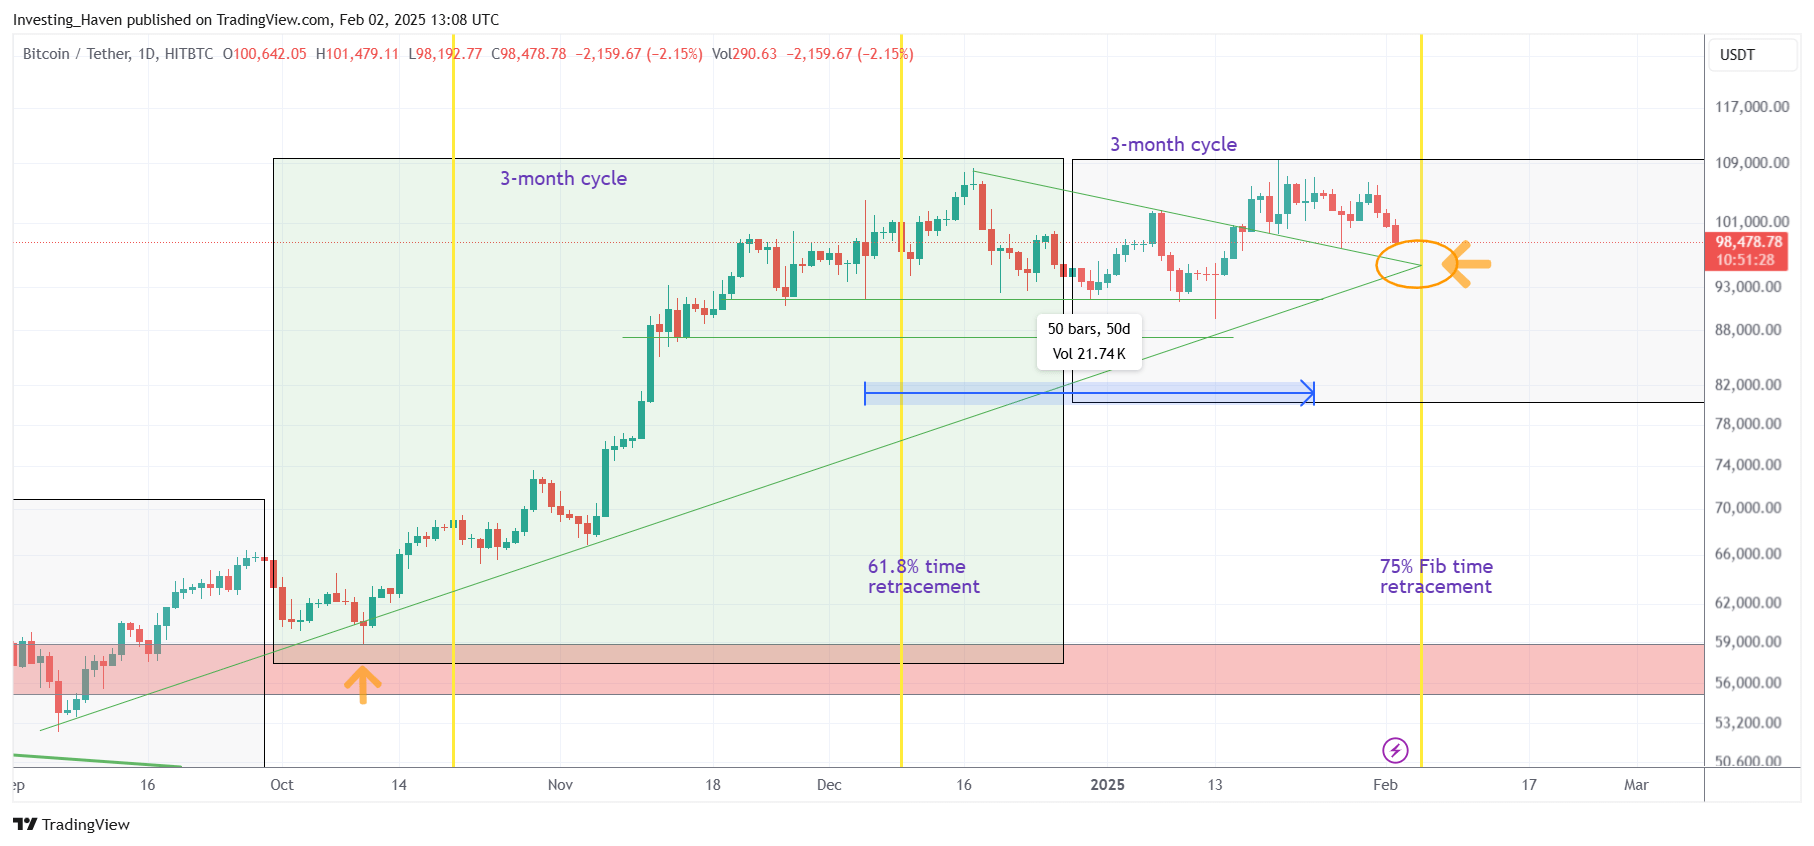
Our timeline analysis suggests that the highest intensity period of the year will be February 5th, 2025, until mid-March, the 25% Fibonacci point on Bitcoin’s timeline.
The BTC chart confirmed our timeline readings published in the restricted research area throughout January. What’s more, going forward, we see that the trendlines and Bitcoin’s 25% Fibonacci retracement date (Feb 5th) coincide around $95k.
February 2nd – All the points above are crucial to understand if February will be bullish, and $95k on Feb 5th, 2025, is the important price/date combination to watch.

USD up, Yields up, Bitcoin price down
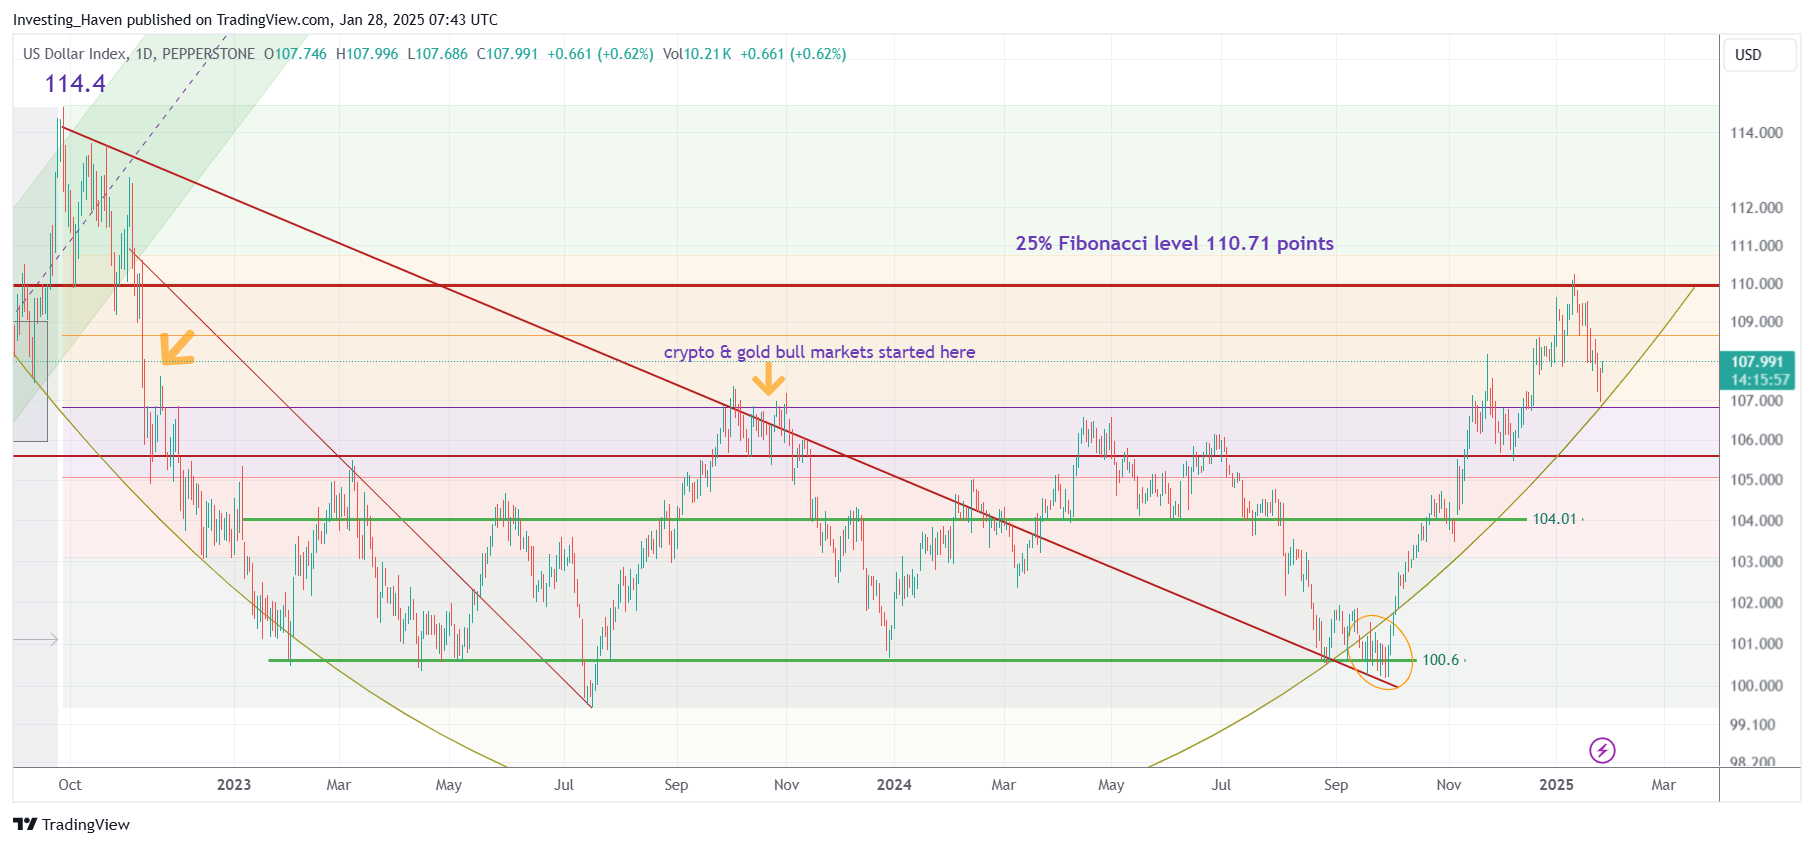
The second reason why the Bitcoin price is down has to do with USD strength combined with Yields strength:
Morning Bid: Strong dollar, rising yields hog the spotlight
Dollar strengthens as solid U.S. data pushes up bond yields
The USD remains very strong. That’s too much strength for BTC to stay strong. A Bitcoin price drop is the logic outcome.

Conclusion – Only if Yields and the USD find resistance around current levels will it stop Bitcoin and crypto markets from dropping.
Bitcoin price down: a psychological level + sentiment
Another aspect that plays an important role is the importance of the $100,000 level.
It’s a psychologically very, very important level.
In fact, the $100k level is the point from where accelerated moves start, in both directions.
What was really concerning? The overly bullish sentiment of investors.
As we run a crypto research service, the first in the world of its kind since 2017, connected to hundreds of investors worldwide, we have a good handle on sentiment. We observed overly bullish sentiment, a disbelief that our prediction of a local top would come true. It’s the ultimate contrarian confirmation that even our readers doubt our not-so-bullish prediction.
Both points combined were concerning to us, when plotting this to the chart we found enough evidence to call for a BTC price drop – which materialized on Jan 7th, 2025.
What’s next for Bitcoin?
While it insightful to understand what happened in the past (“Bitcoin price dropping – what happened“), it is more important to understand what it means for the future.
What’s next for Bitcoin?
Frankly, we believe it will be choppy for BTC and crypto markets, but are hopeful that February 5th, 2025, might bring the desired change for crypto investors.


