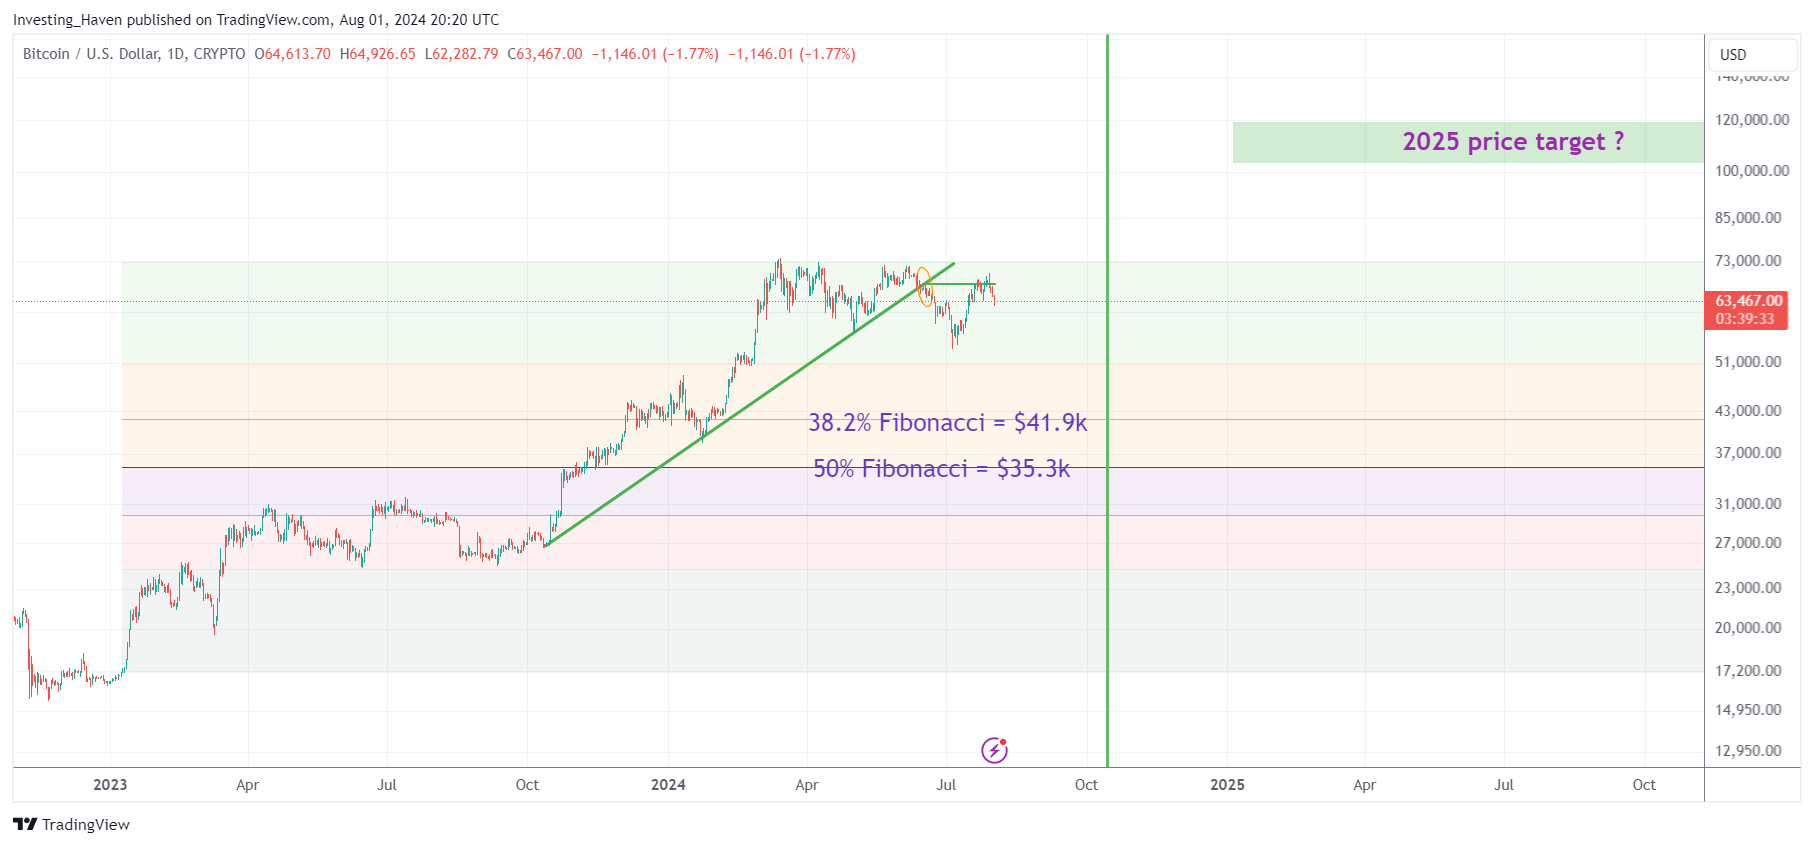
The BTC chart suggests that the last week of August will be crucial. That’s when the BTC price drop should be assessed.
Equally important will be October, as that’s when the 15-month rally will hit its 50% Fibonacci level… on the timeline.
The insights and chart in this article originates from our Bitcoin prediction research, most of all this is what we forecasted many months ago.
We look at Bitcoin’s price drop levels (exhaustion selling candidates), the importance of the timeline and decisive time periods, how to think of Bitcoin as the leading indicator for crypto markets.
Bitcoin price drop on the timeline
This is what we wrote back in May on Linkedin Crypto Timeline Insights: Why October 2024 Will Be Decisive:
What we are saying is that IF Bitcoin is unable to set new ATH, retrace the coming months, and bottom around Oct 14th, 2024, it would be a timeline confirmation of a long-term bullish pattern.
Why does this matter (source)?
One often overlooked rule of thumb is that the time that a bull run took to complete is an important data point. That’s because, very often, the subsequent retracement tends to take 50% of the time of the bull run.
While it is important to analyze price levels, it is equally important to understand the timeline.
This is what we wrote in our research service (access our recent crypto alerts instantly in the restricted area):
July 7th, 2024: “We have very clear time + price levels to watch for a final and lasting sell-off bottom in BTC. In terms of time: the last week of August or around Oct 20th. In terms of price: Either $50k or $41k”
One week later we wrote this:
July 14th, 2024: “In this edition, we look once again at the 3 downside targets for Bitcoin late summer 2024. Specifically the month of August is expected to be volatile according to our timeline analysis.”
Ultimately, the most competent investing methodology combines price insights on decisive time periods. That’s how time and price analysis comes together, and delivers a very powerful investing framework.
Bitcoin price drop levels
The key levels for Bitcoin’s price drop, which has legs, are:
- The 25% Fibonacci retracement level: $51.5k.
- The 38.2% Fibonacci retracement level: $41.9k.
- The 50% Fibonacci retracement level: $35.3k.
While we are not predicting that BTC will drop to all those levels, we cannot exclude it neither. The odds of hitting those levels goes from high to low in the inverse Fibonacci order – very high probability that $51.5k will be hit, a reasonable probability that $41.9k will be hit, a rather low probability that $35.3k will be hit. Below $35.3k is very low.

Bitcoin price drop: buy opportunity in BTC vs. alts
Assuming the market will offer a buy the dip opportunity, as said either late August or mid-October, the question is:
- Buy the dip in BTC?
- Buy the dip in alts?
- Both?
The answer to this question is complicated, very complicated.
That’s because of the intensifying bi-furcation that characterizes crypto markets.
The fact of the matter is that most altcoins will underperform in the coming crypto bull cycle. We predict that only a minority of tokens will become multi-baggers. Many will do well, but not unusually well (10x or more).
Which ones will outperform?
That’s exactly what we wrote about in recent weeks. We believe we see a very clear trend, and we see it clearly.
- Warning: Dominant Dynamics In Crypto Markets. Also, Prepare For Buy The Dip Opportunities In These Tokens. (Aug 1st, 2024)
- The Next Big Wave + Two Solana Token Tips (July 23d, 2024)
While it is too early to re-enter the crypto market with new positions, it certainly is possible to see what the next big narrative might be.


