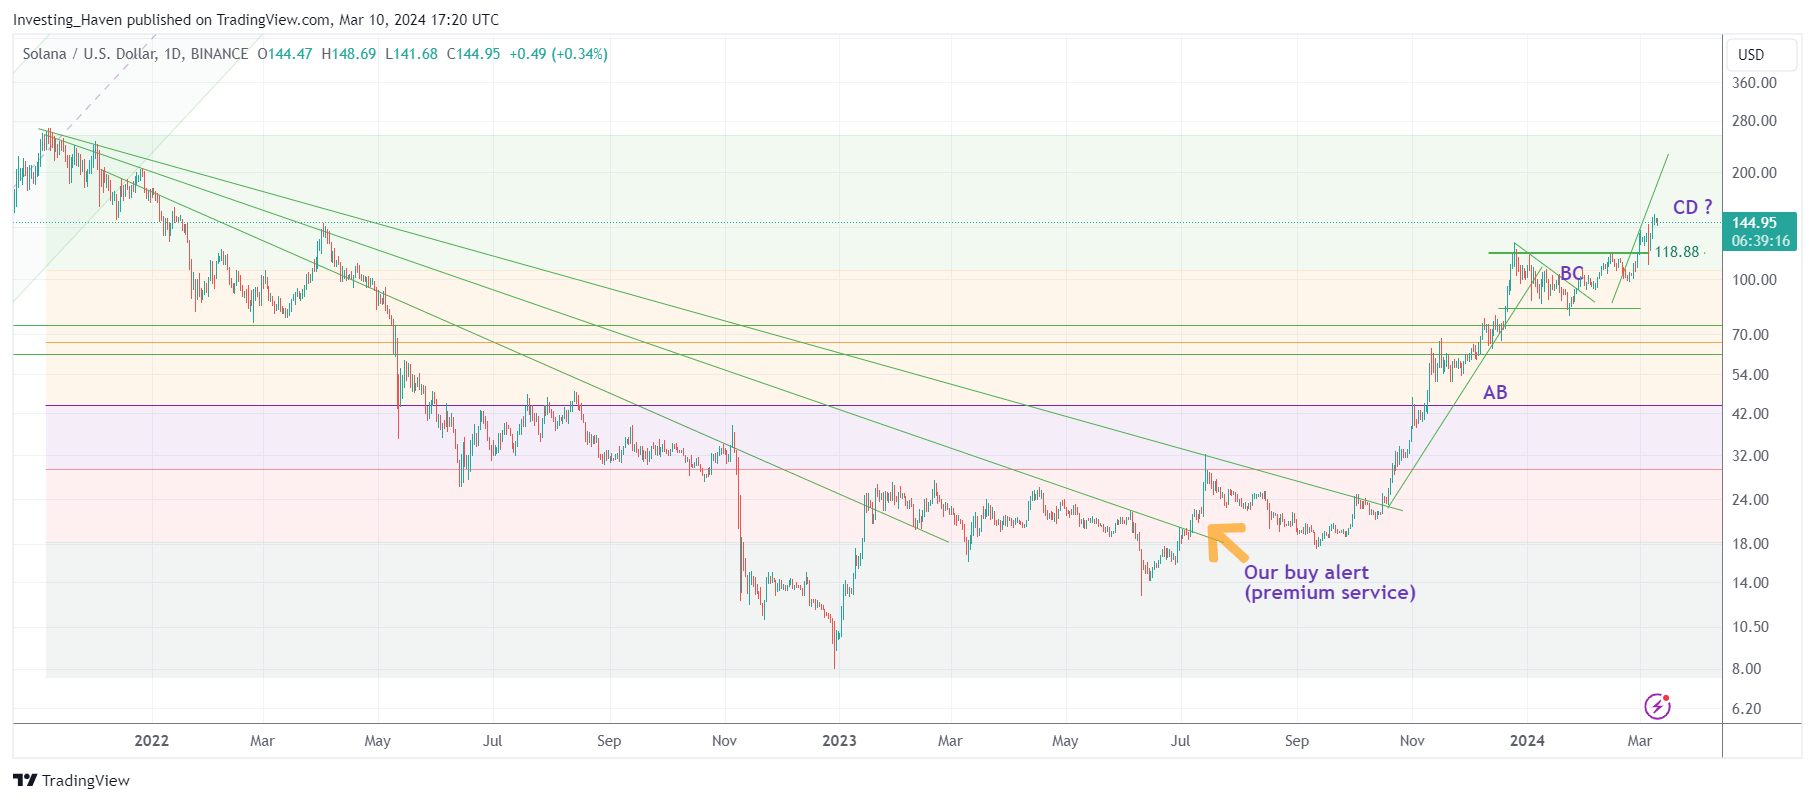
If Solana can clear $142.44 it will be ready to move to ATH. In that case, the SOL uptrend will be a clear ABCD chart pattern.
Related – Can The Price Of Solana (SOL) Exceed $1,000 By 2030?
As we write this article, Solana (the organization) announces growth plans:
The Solana ecosystem is growing, and that means teams are hiring!
Over 150 opportunities are available for developers, marketers, analysts, and more.
While this is nothing short of impressive, we need to continue to stay disciplined and look at network growth as a supporting data point, not a leading indicator for price.
No matter how bullish we may be on the SOL uptrend, it is the SOL chart that has the last word.
SOL uptrend continues?
That’s the million dollar question – will the SOL uptrend continue or not?
In our recent article When Will Solana (SOL) Hit All-Time Highs we mentioned two crucial price points, i.e. $118.88 and $142.44. They are an area, a really important area on Solana’s price chart.
Momentum is kicking in – that’s great news for quality tokens like Solana (X). The price chart has a clear message: once $118.88 is cleared, the breakout level, with 5 daily candles exceeding this breakout point, it will be the ultimate confirmation that SOL wants to move to ATH.
We continued with a few SOL uptrend rules:
- The price point $118.88 should be cleared, convincingly.
- This means 5 daily candles above this price point without touching it.
- Ultimately, once this happens, also $142.44 should be cleared as well, it’s a small hurdle to overcome.
At the time of writing, Solana has:
- Three daily candles above $118.88 – no confirmed breakout yet.
- No daily candles above $142.44 – no confirmed breakout yet.
While momentum is brewing, there is no confirmed breakout. So far, the area $118.88 – $142.44 is providing resistance. It will be resistance until it isn’t, simple as that.
SOL uptrend to turn into an ABCD chart pattern?
As SOL is consolidating in the $118.88 – $142.44 area, we see a clear chart pattern unfolding.
Provided the last hurdle at $142.44 is decisively cleared, the SOL uptrend will morph into an ABCD pattern:
- AB – SOL uptrend in Q4 of 2023.
- BC – corrective move in January and February of 2024.
- CD – the last leg of the SOL uptrend in the period March/April/May of 2024.
The chart says it all.
Again – the prerequisite for the uptrend continuation in the price of SOL is a decisive move above $142.44.

SOL uptrend – what’s the target?
Now, assuming the resistance point at $142.44 is cleared, how high can SOL rise?
This is what we wrote in one of the many Solana articles on our blog:
- IF SOL hits former ATH in March of 2024, it might exceed ATH in April/May of 2024.
- IF SOL hits former ATH in April of 2024, we expect former ATH to act as resistance. In that scenario, we expect SOL to exceed ATH either late 2024 or in 2025.
So, we think in terms of time/price combinations.
That’s how we believe any uptrend price target should be assessed.
A potential 100-bagger in Solana’s ecosystem?
While playing Solana on the long side is a justified idea, provided $142.44 is cleared, the upside potential remains limited. As seen on the SOL chart, featured above, we sent a buy alert to premium members when SOL was trading around $25 some 9 months ago.
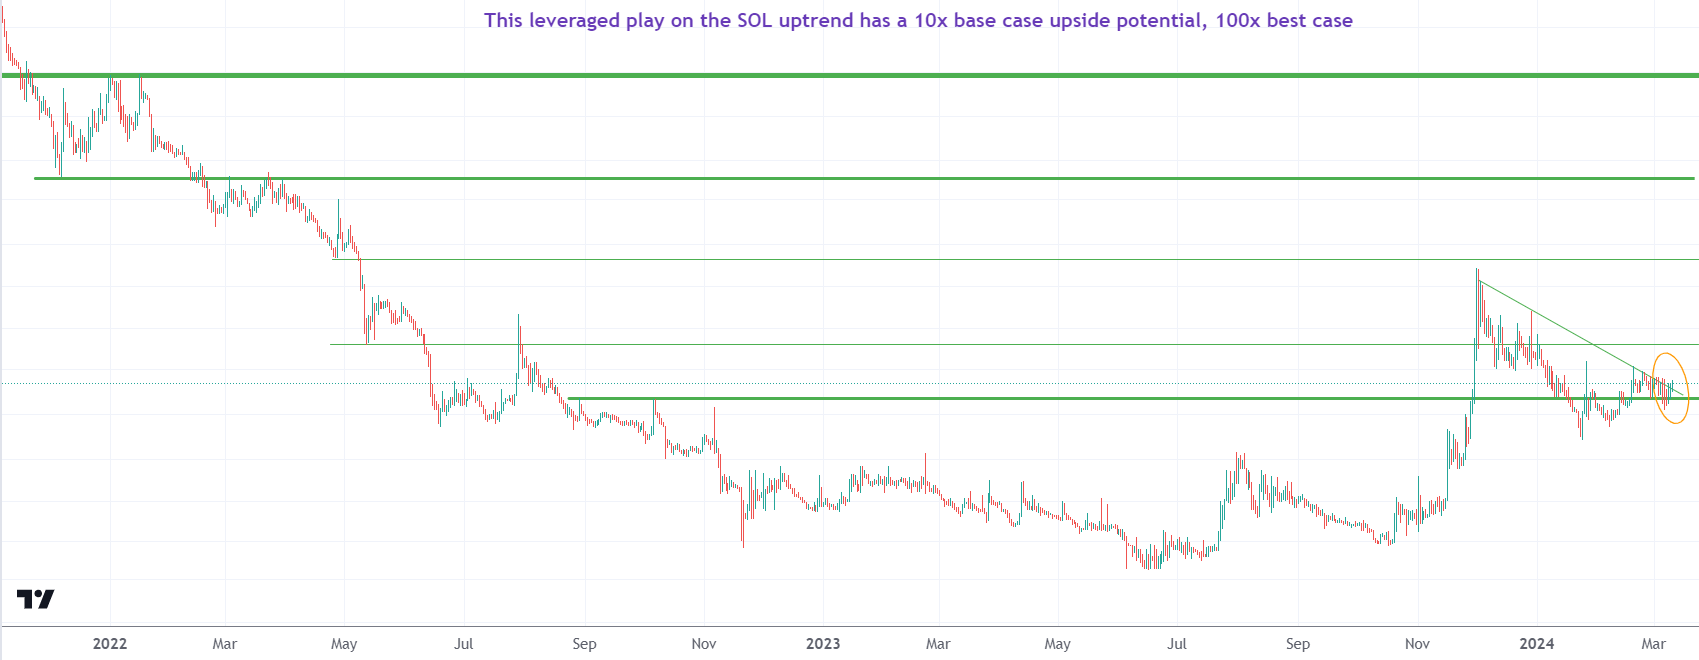
In our crypto research service, we identified a much higher risk/reward play than Solana, in its ecosystem.
In a way, it is a leveraged play on the SOL uptrend.
You can read our alert here (sign up here): The Highest Risk Reward Solana Play – 100x Candidate).
The chart of this tiny token in Solana’s ecosystem is shown below, we left away symbol and price points, just to make the point how powerful this chart is. Readers interested in the details can find a detailed alert here.

Remember, hitting a 100-bagger is exceptional. While our Solana ecosystem token tip might go up 100x, it’s good practice to take the principal investing amount out once price doubles, to de-risk the position and let profits freely run, assuming the token will go up 100-fold in 24 months from now.


