While the price drops of August 1st and 2nd may not feel well, the XRP price retracing was to be expected looking at XRP charts from a price and timeline perspective.
As explained in great detail in our XRP prediction research section, July 31st, 2024, marked the end of a 4-week bullish time window for XRP. The first week of August marked the start of a volatility window, as explained in numerous articles, all archived in our crypto forecasts section.
XRP price retracement: expected & forecasted
Our timeline analysis clearly suggested that XRP would hit resistance, on the timeline, in the first week of August.
We explained this in our research service but even in the public domain on July 24th, 2024.
READ – XRP Price: A Pressure Cooker Before D-Day
While we have high expectations for the coming 10 trading days, we also believe that price action will soften in August 2024. That’s not specific to XRP; it’s broad market weakness in our view that will hit markets.
What this really means for XRP investors is that they should consider August 2nd, 2024, to be a cut off date, sort of a decision date.
We continued:
If XRP will have moved up significantly by that date, it might suggest a profit taking moment.
If XRP will not have moved by then, it becomes a matter of time horizon (is XRP a long term vs. short term holding). Moreover, for XRP holders that want to accumulate as many as possible tokens, it might be an average down opportunity.
XRP price drops: be careful relying on irrelevant info
Only 2 XRP charts matter. Don’t overload yourself with irrelevant information.
Typically, when prices drop, investors tend to look for information. The web is full of irrelevant information, certainly when it comes to financial content.
To make this point, readers may want to open this XRP news section.
Good luck with this type of information gathering strategy.
What matters is the chart.
What matters most, is the right chart and chart readings on the price and timeline.
With this in mind, we are happy to pick the 2 most important, arguably the 2 only relevant price charts for XRP investors and enthusiasts.
XRP price retracement: The long term reversal
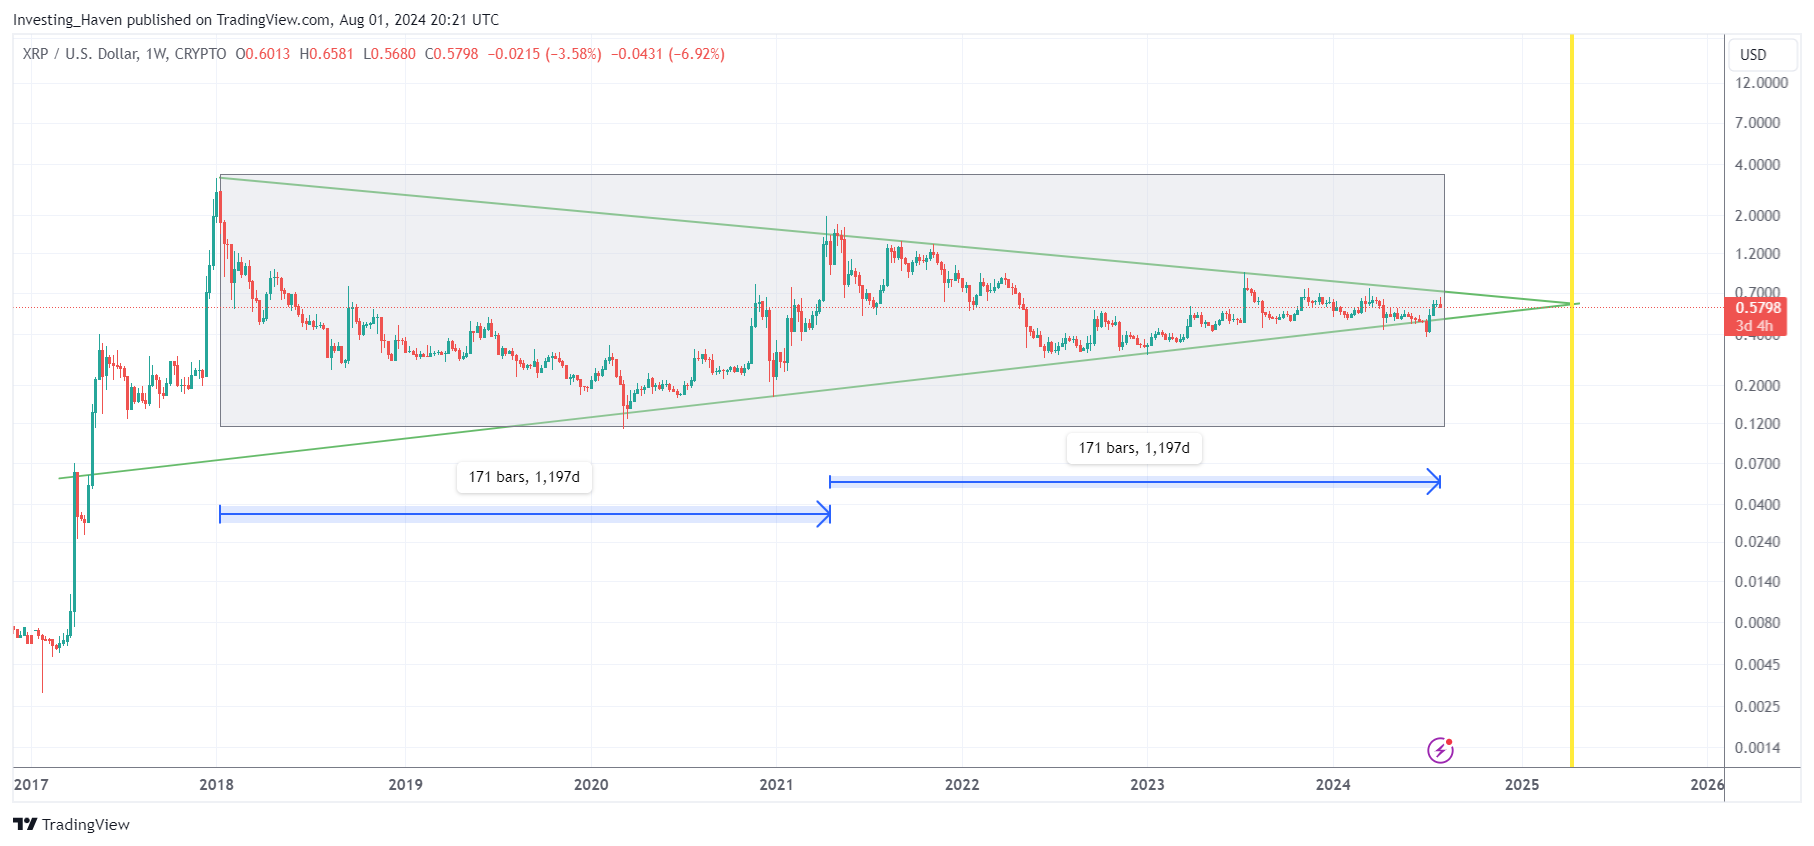
The first chart is a long term XRP chart featuring the long term reversal structure.
What is so obvious from this chart is the willingness and desire of XRP to complete a bullish reversal structure. The shape is a W-reversal, the trendlines create a bullish triangle.
- As long as XRP trades within this structure, it is bullish.
- Once XRP exceeds $0.66, for 3 to 5 consecutive weeks, without touching $0.66, it marks a breakout.
While XRP could have broken out after completing a perfect symmetric structure, lasting 2x 171 weeks, as indicated on the chart, it seems that ‘the time was not right for XRP.’ The next breakout window, on the timeline, is the period Sept-Dec 2024.
It’s really as simple as that. All the rest is noise; all other news and content will only confuse investors.
There was a lot of hype, lately, on X, as evidenced by the posts on the $XRP cash tag. We noticed lots of XRP charts, suggesting a secular breakout already started. We firmly disagree. The one and only timeframe that works for a chart like XRP is the weekly timeframe. We need full weekly candles to close above the triangle structure before getting excited; everyone on Twitter missed this crucially important charting practice!

XRP price retracement: The retracement levels
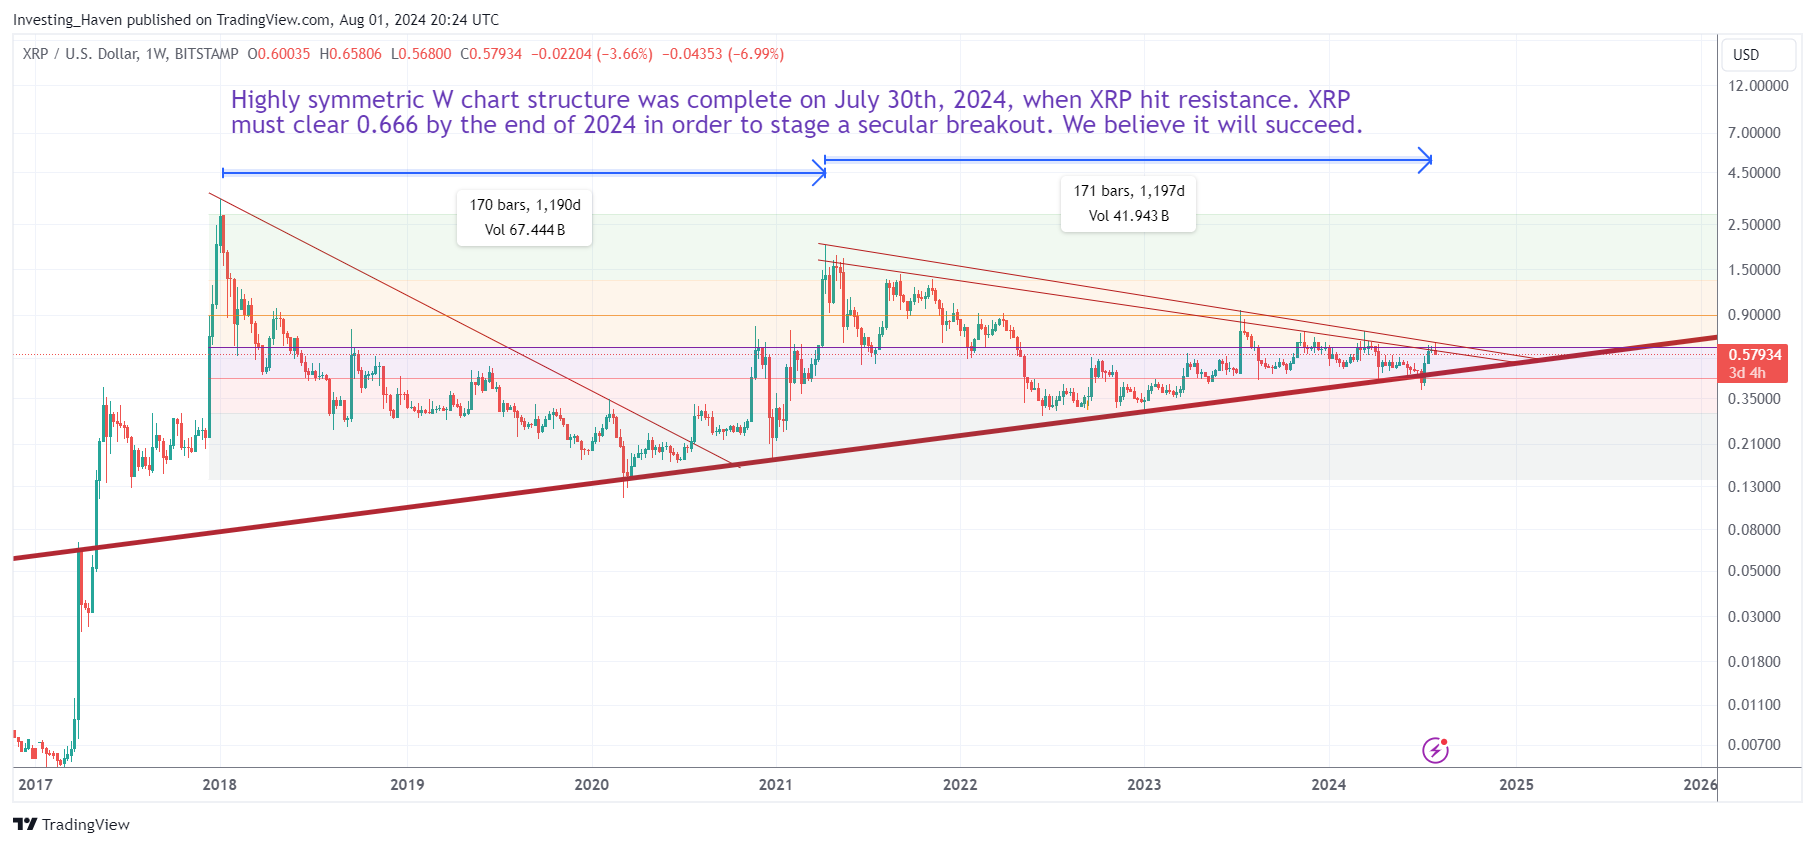
The second chart is a long term XRP chart featuring the retracement levels of the long term consolidation.
A long consolidation feels boring, right?
While it feels boring, it tends to be very bullish provided key support levels and structures are respected.
So far, XRP has respected all key support levels and structures.
The XRP is bullish beyond words as long as the support structures are respected on the weekly chart!
The chart says it all.
Going forward, only a breakout above $0.66, the point where XRP hit resistance on July 31st, 2024, completion of its 4-week bullish window, will mark a secular breakout. If and when this happens, the bullish energy that will be unleashed will be tremendous. Invalidation: a break below $0.35.

To XRP or not to XRP
We have served deep analysis on ongoing trends, particularly visible ‘under the hood’, of what the next big trend in crypto markets may be.
In our premium research service, we are looking for the next big narrative!
We believe we have found a pattern as explained here in our research area:
- Warning: Dominant Dynamics In Crypto Markets. Also, Prepare For Buy The Dip Opportunities In These Tokens. (Aug 1st, 2024)
- The Next Big Wave + Two Solana Token Tips (July 23d, 2024)
We have a very clear viewpoint on whether XRP fits this next narrative or not. It is explained in great detail in our latest two research notes, mentioned above.
Hint: XRP should be part of the next big wave.


