Our commodities outlook 2023 is neutral for most commodities. In fact, we believe that 80% of commodities will not be worth an investment. What about the remaining 20%? There is a handful of commodities that are worth watching, and only a few that are worth being invested in. As we’ll see in this article the divergence between commodities is really significant. Our top pick? Silver! We said so many times and are only more convinced with recent data points that all underpin the BIG silver bull run to start in 2023.
We wrote quite some articles lately about commodities and their outlook in 2023. This is an overview:
Silver Price Forecast For 2023 and Gold Price Forecast for 2023
Silver: A Divergence Of Epic And Historic Proportions
Uranium Market Outlook 2023: Bullish Bias
Nickel About To Heat Up As 2023 Kicks Off
Lithium Forecast: Lithium Stocks Will Be Wildly Bullish In 2023
A Very Bullish Graphite Stocks Forecast For 2023
Which Green Battery Metal Looks Best As 2023 Kicks Off?
How To Play The Green Battery Super Cycle In 2023?
In our chartbook 2023 we included 120 must-see charts and summarized it with 12 conclusions. In this commodities outlook article we’ll feature one of those conclusions, particularly about the commodities market. Readers are encouraged to sign up to Momentum Investing to access the chartbook, it is a must-read document.
An anomaly in the commodities market
Let’s face it, 2022 was an anomaly year. We noticed so many unusual things and events. We wrote about this:
2022 Market Anomaly: Can Commodities And The US Dollar Rise (and Top) Concurrently?
Strangely, most commodities were moving higher in the first 6 months of 2022 amid a rising USD. In the 2nd half of 2022, most commodities topped as the USD topped.
Please read the above sentence a few times. This won’t occur again in our lifetimes, rest re-assured.
Commodities Outlook 2023: overview
From our 2023 chartbook we are going to summarize the conclusions specifically for the commodities market. As said, we encourage readers to sign up to Momentum Investing to access all 120 charts and all sector trend conclusions, beyond commodities.
- The few commodities that have a bullish setup or bullish bias as metals and alternative energy related commodities.
- Commodities that do not look good: agriculture, coffee, cotton.
- Commodities with an unclear setup: crude oil, natgas, soybeans.
- Commodities with a bullish bias: gold, base metals, aluminium, uranium.
- Commodities that stand out: silver, steel, sugar.
We’ll pick out three commodities to visualize the bi-furcation that is currently dominant in the commodities space. It also illustrates our commodities outlook 2023.
Commodities Outlook 2023: strongly bullish
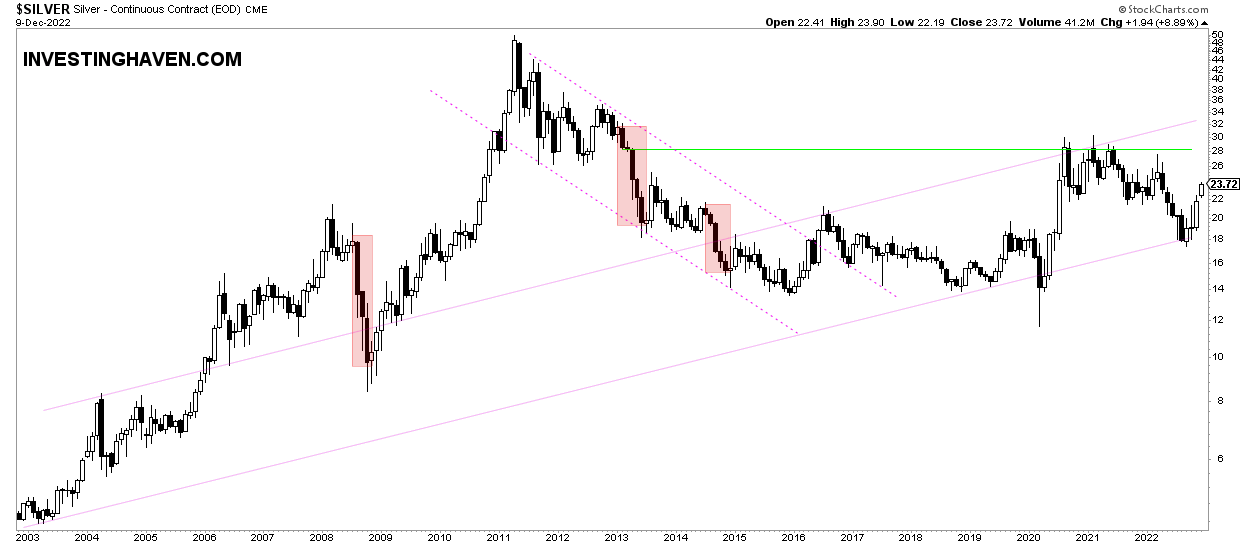
Silver is probably the most promising commodity for this decade.
We write a lot about silver both in the public domain (silver tag) but also in our premium services. Silver has a track record of running very hard and fast, in both directions. There is a very good reason why silver is called the restless metal.
The 20 year silver chart makes the point: a multi-decade rising trend was tested a few months ago. First bullish target around 36 USD/oz consistent with our silver price forecast 2023.
In our Momentum Investing service we featured our top silver selection, on December 1st, in a premium article entitled The Silver Market Long Term Very Bullish. Our Silver Mining Top Picks.
Commodities Outlook 2023: bullish bias
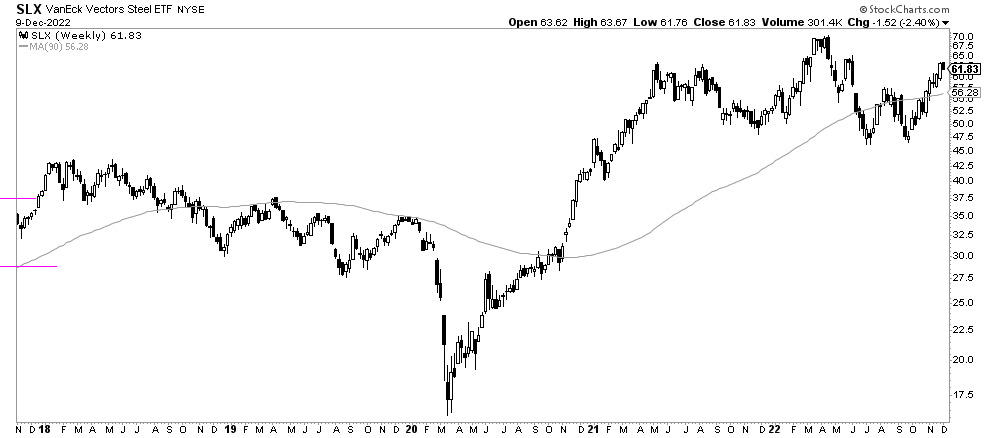
Steel stocks don’t look bad. They have a bullish bias going into 2023.
SLX ETF, representing steel stocks, needs to clear 66 in order to confirm its bullish intent.
Interestingly, the long term moving average is still rising!
Commodities Outlook 2023: bearish
On the flipside, agricultural commodities do not look good. A multi-decade triple top was set in 2022. Although this market is not necessarily going to crash it certainly seems unlikely that it will move to ATH.
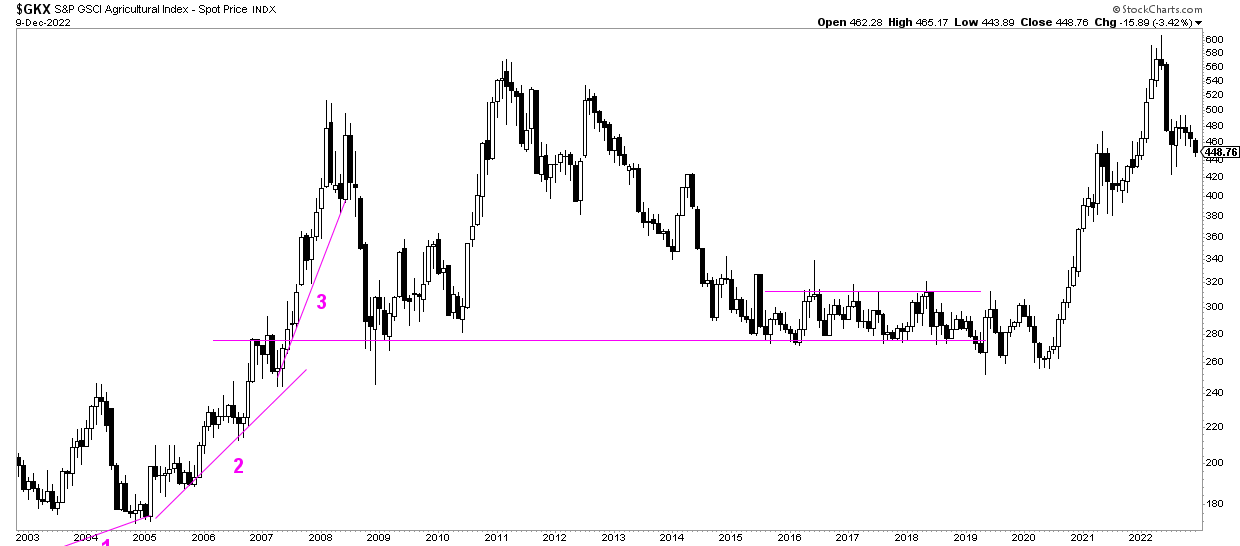
By comparing the 3 charts readers should get a sense of the bi-furcation that is currently dominant in commodities markets.
We firmly believe that silver is one of the few commodities along with green battery metals to be invested in this decade.
Must-Read 2023 Predictions – We recommend you read our 2023 predictions as they are very well researched:


