
In the dynamic world of financial markets, emotions and opinions often cloud the path to successful investing. Our mission is to provide investors with a logical and data-driven analysis to neutralize these influences. In this article, we will explore leading indicators to (in)validate the sentiment that is dominant with many investors: high levels of fear, particularly for a market crash to occur in 2023. We did not forecast a bearish turning point to occur this year as evidenced by articles that we published well before 2023 kicked off: 2023 Market Trends and 5 Investing Tips For 2023. In this article, we look at up to date data to confirm what we said and wrote in the past.
In doing so, we will remain committed to our structured methodology, analyzing leading indicators and chart patterns to forecast the possibility of a bearish secular turning point in 2023 which, as will appear, is very low to non-existent.
Bearish Turning Point Forecasting Method
Our forecasting methodology is built on a robust and structured approach, designed to unravel the complexities of market trends and predict future movements. At the core of our methodology lie three fundamental elements: leading indicators, chart analysis, and market dynamics insights.
- Leading Indicators: To gain comprehensive market insights, we meticulously select a fixed set of leading indicators that are most relevant to the forecast’s scope. These indicators encompass various aspects of the financial landscape, such as sentiment analysis, yield curve behavior, liquidity levels, USD performance, and cycle patterns. By analyzing these indicators, we can uncover valuable clues about the market’s current state and potential future trajectory.
- Chart Analysis: In tandem with our leading indicators, we delve into the intricacies of chart patterns to identify critical price points and dominant structures that influence ongoing and future trends. The examination of charts aids in corroborating the data from leading indicators, providing a comprehensive view of the market’s behavior. Our commitment to chart analysis ensures that our forecasts are grounded in empirical evidence, offering a clear understanding of the market’s dynamics.
- Market Dynamics Insights: Acknowledging the evolving nature of financial markets, we recognize the importance of understanding market rotation thoroughly. Since 2022, continued market rotation has been a prominent feature, with specific groups making significant moves while others remain relatively stagnant. Sector and asset class rotation play a pivotal role in shaping market trends, and as forecasters, we diligently monitor these rotations to anticipate potential bullish trends and volatility windows.
By integrating these elements into our forecasting methodology, we strive to present investors with well-informed predictions that transcend emotional biases and opinions. Our dedication to a structured and data-driven approach enables us to unravel the complexities of the financial landscape and provide our audience with reliable insights for their investment decisions.
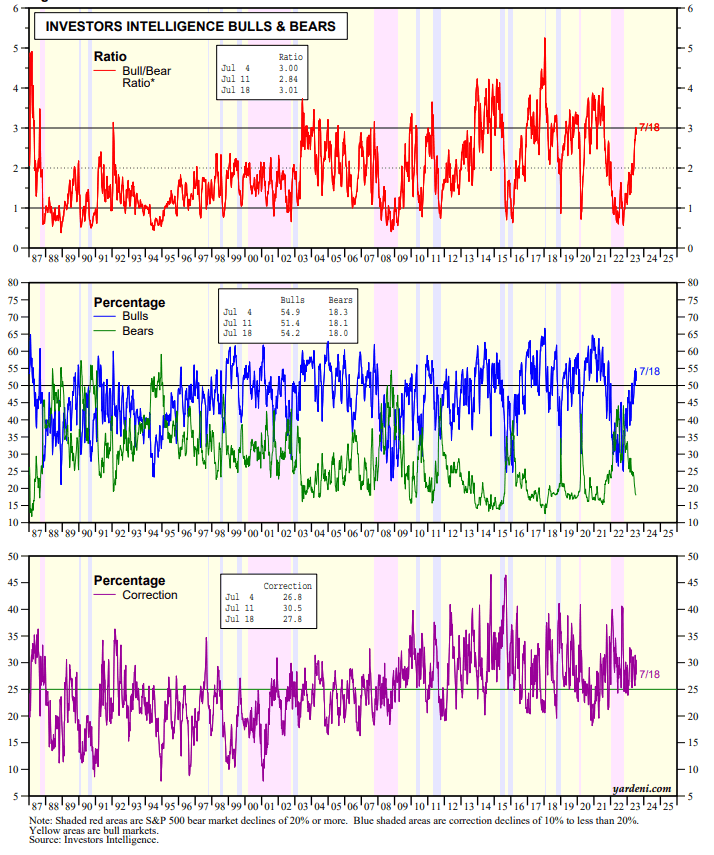
1. Sentiment: The Emotional Landscape of Investors
Sentiment analysis, which goes beyond simple fear & greed indicators, plays a crucial role in market forecasting. Currently, approximately 30% of investors expect a market correction, indicating a degree of caution among market participants. While there are 54% bulls, their optimism is tempered by the presence of 18% bears, creating a balanced sentiment landscape. This balanced sentiment suggests that the market may not be overly bullish, which is a potential signal that a bearish turning point might not be imminent. Chart courtesy: Yardeni.
2. Inverted Yield Curve: Unraveling the Significance
The yield curve inversion in mid-2022 triggered concern among investors, as it traditionally signals an impending recession. However, it’s essential to discern the underlying dynamics of the market beyond this indicator. In this case, the yield curve inversion did not lead to a widespread economic downturn; instead, it caused a specific crisis in the regional banking sector. By focusing on the broader economic landscape and considering other leading indicators, we can gain a more comprehensive view of the market’s trajectory.
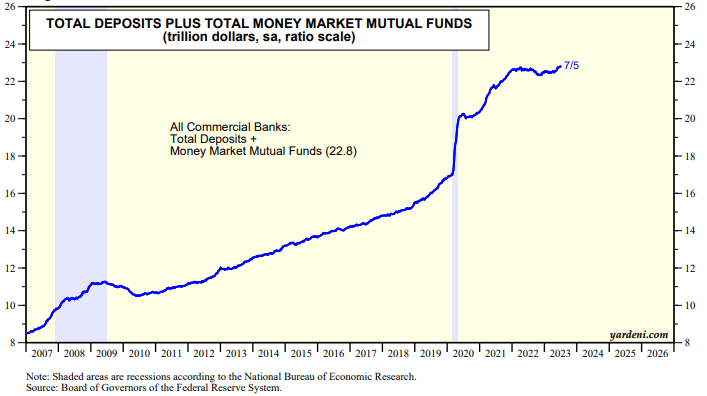
3. Liquidity not Forecasting a Bearish Turning Point in 2023
Liquidity is the lifeblood of the financial system, and understanding its current state is critical for forecasting. Presently, the system enjoys an abundance of liquidity, with a significant portion sitting on the sidelines. This surplus liquidity has the potential to be deployed into risk assets, potentially driving prices higher and preventing a bearish turning point. A close examination of liquidity levels in the market reinforces our optimistic outlook for 2023.
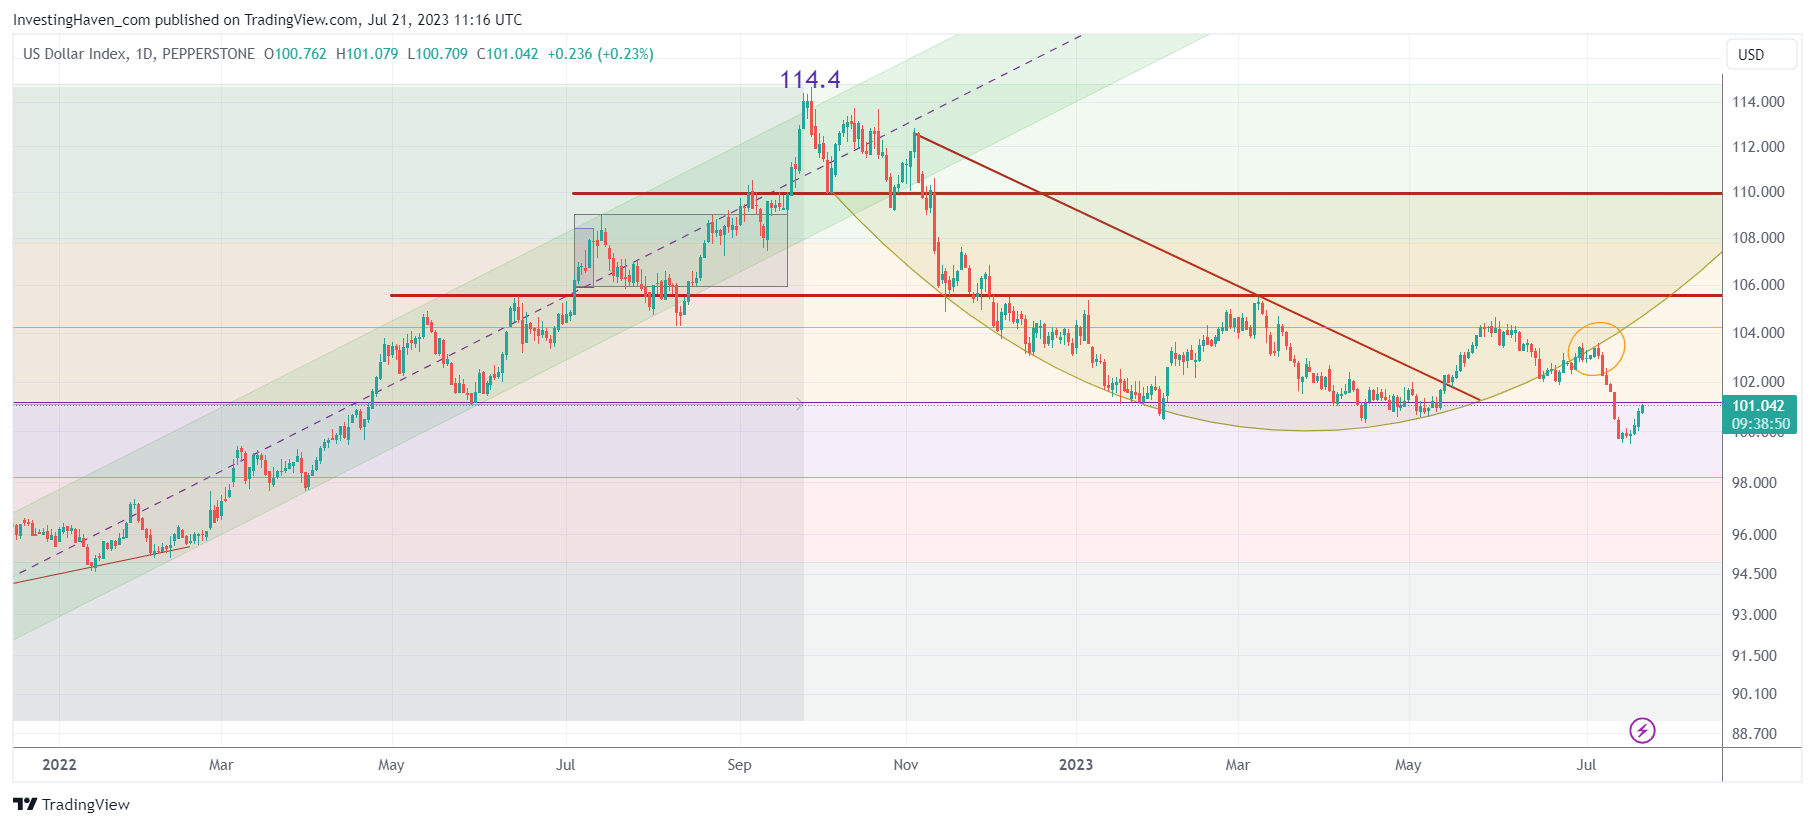
4. USD not Forecasting a Bearish Turning Point in 2023
The USD’s deflationary pressures have been pronounced, particularly in July, and its performance can have far-reaching effects on risk assets. A weakened USD is generally favorable for risk assets, as it would require substantial strength to pose a threat to the overall market. Evaluating the potential for the USD to create a robust uptrend that could trigger a bearish turning point is crucial in our forecasting process.
5. Timeline Readings: Navigating Market Cycles
Cycle analysis is a powerful tool in understanding market dynamics and forecasting trends. In the context of 2023, it suggests favorable market conditions until December, with only one projected volatility window during this period. While volatility windows may raise concerns among investors, it’s essential to recognize that they are part of the natural market cycle. By factoring in these timeline readings, we can better assess the likelihood of a bearish secular turning point.
Forecast: Navigating the Path Ahead
Based on our meticulous analysis of leading indicators and chart patterns, our forecast for 2023 remains generally positive. We do not foresee a market crash; instead, risk assets are expected to perform well. Sector rotation will likely be a dominant theme, driving specific sectors higher at different times, while not necessarily moving concurrently. Moreover, the upcoming volatility window in 2023 is not anticipated to trigger a crash or a bearish secular turning point.
Looking for sectors to invest in?
- AI & Robotics: Top Stocks For Long Term Portfolios
- Silver: Top Stocks For Long Term Portfolios
- Silver: Top Stocks For Long Term Portfolios
Invalidation Criteria
If all of the above leading indicators turn bearish (with the USD the only one to turn bullish), we will start getting concerned and the likelihood of a secular bearish turning point to occur will start rising exponentially.
Conclusion: no Secular Bearish Turning Point in 2023
In conclusion, this article has delved into the intricacies of forecasting the next secular bearish turning point in 2023. By adopting a structured methodology, analyzing leading indicators, and charting the market’s trajectory, we have arrived at a logical and data-driven forecast. While fear and opinions may abound in the financial landscape, our commitment to presenting factual insights will empower investors to navigate the market’s twists and turns with confidence.


