
Since its 52-week high of $88.84, the share price of Singaporean e-commerce giant Sea Limited (NYSE: SE) has declined by 59.7%. Let’s take a look at several factors prior to making our $SE stock forecast.
Investor sentiment has been dampened by the company’s recent entry of ByteDance’s TikTok into the Indonesian e-commerce market, difficulties in its gaming business, a high cash burn rate, and an unexpected loss in the third quarter of fiscal 2023.
See related stock forecasts for: $META | $COIN | $MU | $ONON
Sea Limited ($SE) company overview
SeaMoney, the digital financial services division of Sea, generated $446.2 million in revenue during the third quarter, representing an annual growth rate of 36.5%.
Additionally, the organization successfully recovered its adjusted EBITDA, which amounted to $165.7 million.
With 1.6% non-performing loans overdue by more than 90 days, SeaMoney maintains a solid credit profile; this represents a 40-basis-point improvement from the previous quarter.
Despite a sequential improvement, Sea’s gaming division, Garena, encountered a decline in bookings during the third quarter compared to the same period last year.
The delayed relaunch of Free Fire in India is anticipated to increase Garena’s revenue eventually.
Sea continues to rely heavily on Garena as a revenue generator, as adjusted EBITDA accounted for 52.2% of total bookings in the third quarter.
$SE imagine a bounce pic.twitter.com/fm7U2r9kTP
— Jtrades (@Jhswings27) December 24, 2023
Sea is trading at a price-to-sales ratio of 1.5x, considerably lower than its three-year average multiple of 7.9x.
Considering the prospective tailwinds and this reasonable valuation, Sea is an appealing long-term investment.
Retail investors might find it advantageous to contemplate procuring a minor investment interest in the organization now.
Let’s see the upcoming price action of this stock from our SE technical analysis.
Has Sea Limited Stock (SE) Set A Bottom?
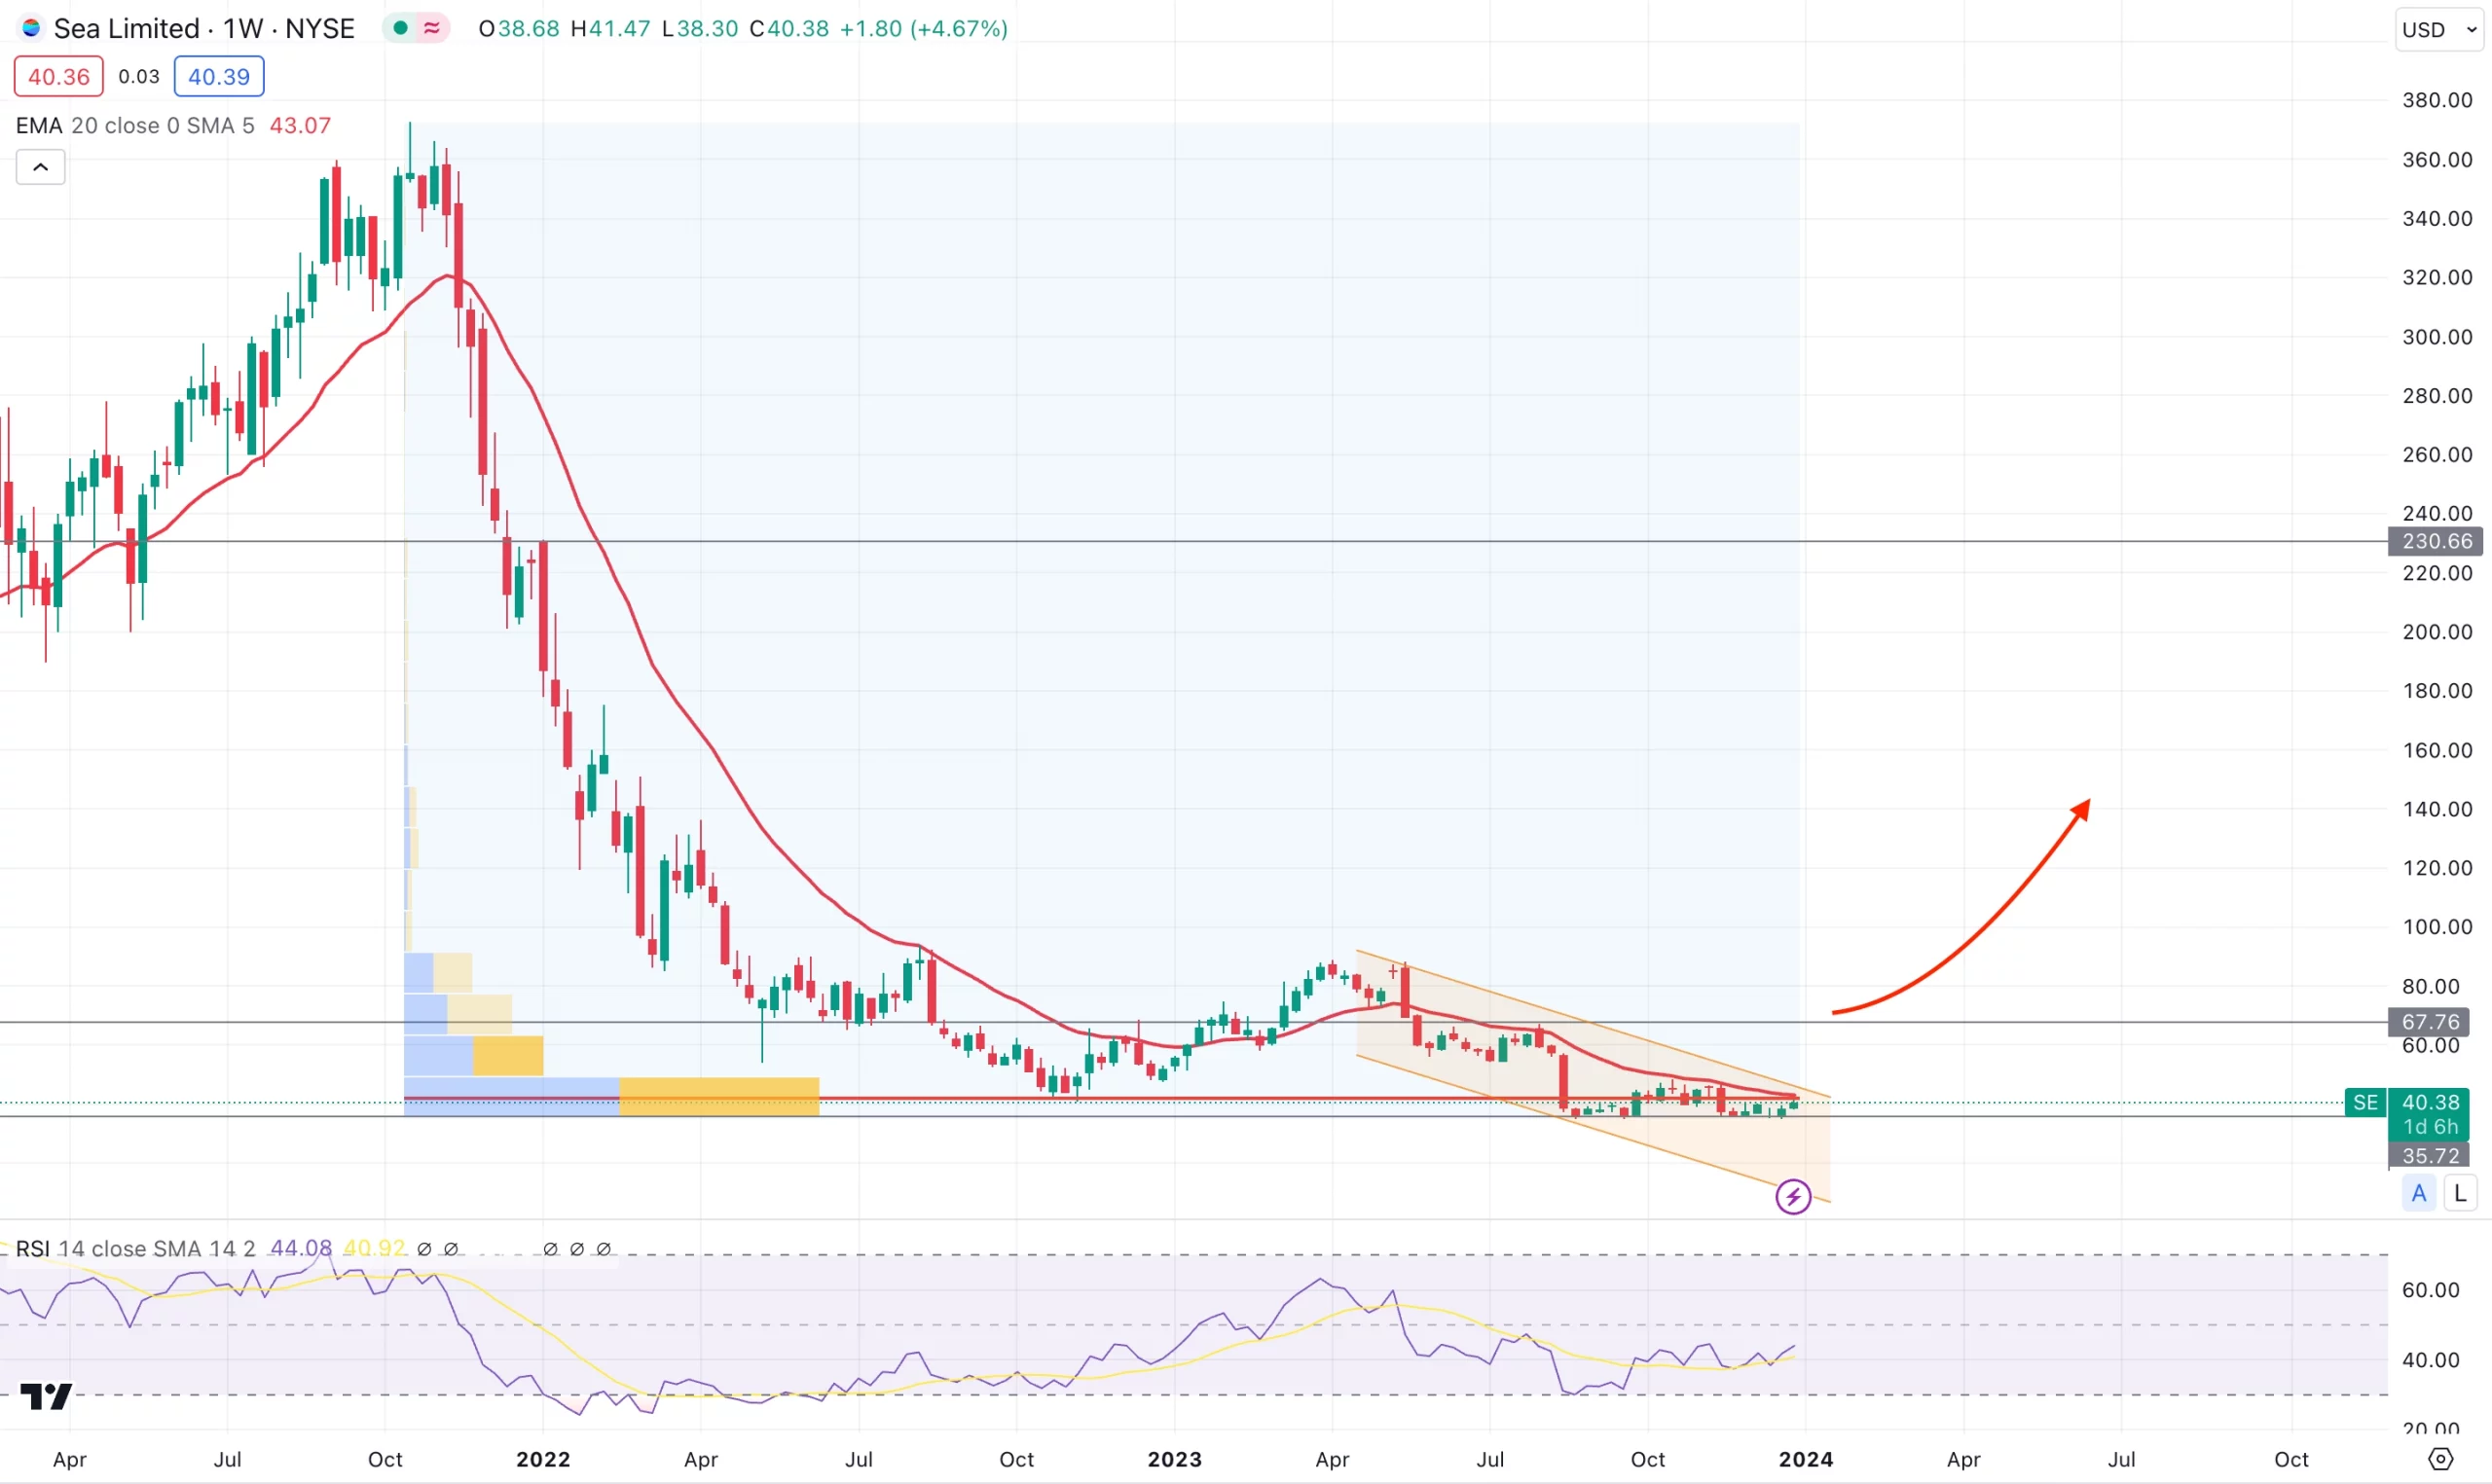
In the weekly chart of SEA, the overall market momentum is bearish as the current price trades sideways below the multi-year low.
Moreover, the recent price trades sideways within an ascending channel, which needs a solid bullish breakout before forming a trend reversal.
In the volume structure, the most active level since the September 2021 high is just above the current price.
Therefore, the current consolidation with a higher trading volume suggests a buyers’ accumulation in the market.
$SE large weekly bull debit spread
$1M total debit
350k share darkpool tied to transaction at 38.47 pic.twitter.com/ntdB62LybA— Taylor (@TLAMB91) December 26, 2023
In that case, the ideal trading approach is to wait for the accumulation to cover with a bullish range breakout before aiming for the trend reversal.
In the monthly chart, the strong bearish came in August 2023, with a sideways market later.
It is a sign of a bearish continuation, where a stable market below the 34.73 monthly low could initiate another bearish leg in the coming months.
In the current chart, the downside continuation is supported by the 20-week EMA, which is the primary indication of a continuation of the bearish trend.
Moreover, the current 14-week Relative Strength Index (RSI) rebounded from the 30.00 oversold zone and remained below the 50.00 line with an upward slope.
A bearish channel extension could offer a short opportunity based on SE’s weekly outlook.
In that case, a bearish weekly close below the 34.00 psychological level could offer a decent sell opportunity, targeting the 16.80 support level.
On the bullish side, investors might find a long opportunity after having a descending channel breakout with impulsive pressure.
In that case, a valid breakout with a weekly close above the 67.76 level could be a conservative long approach, targeting the 230.60 resistance level (on a longer timeframe).
Sea Limited Stock (SE): Ichimoku Cloud Analysis
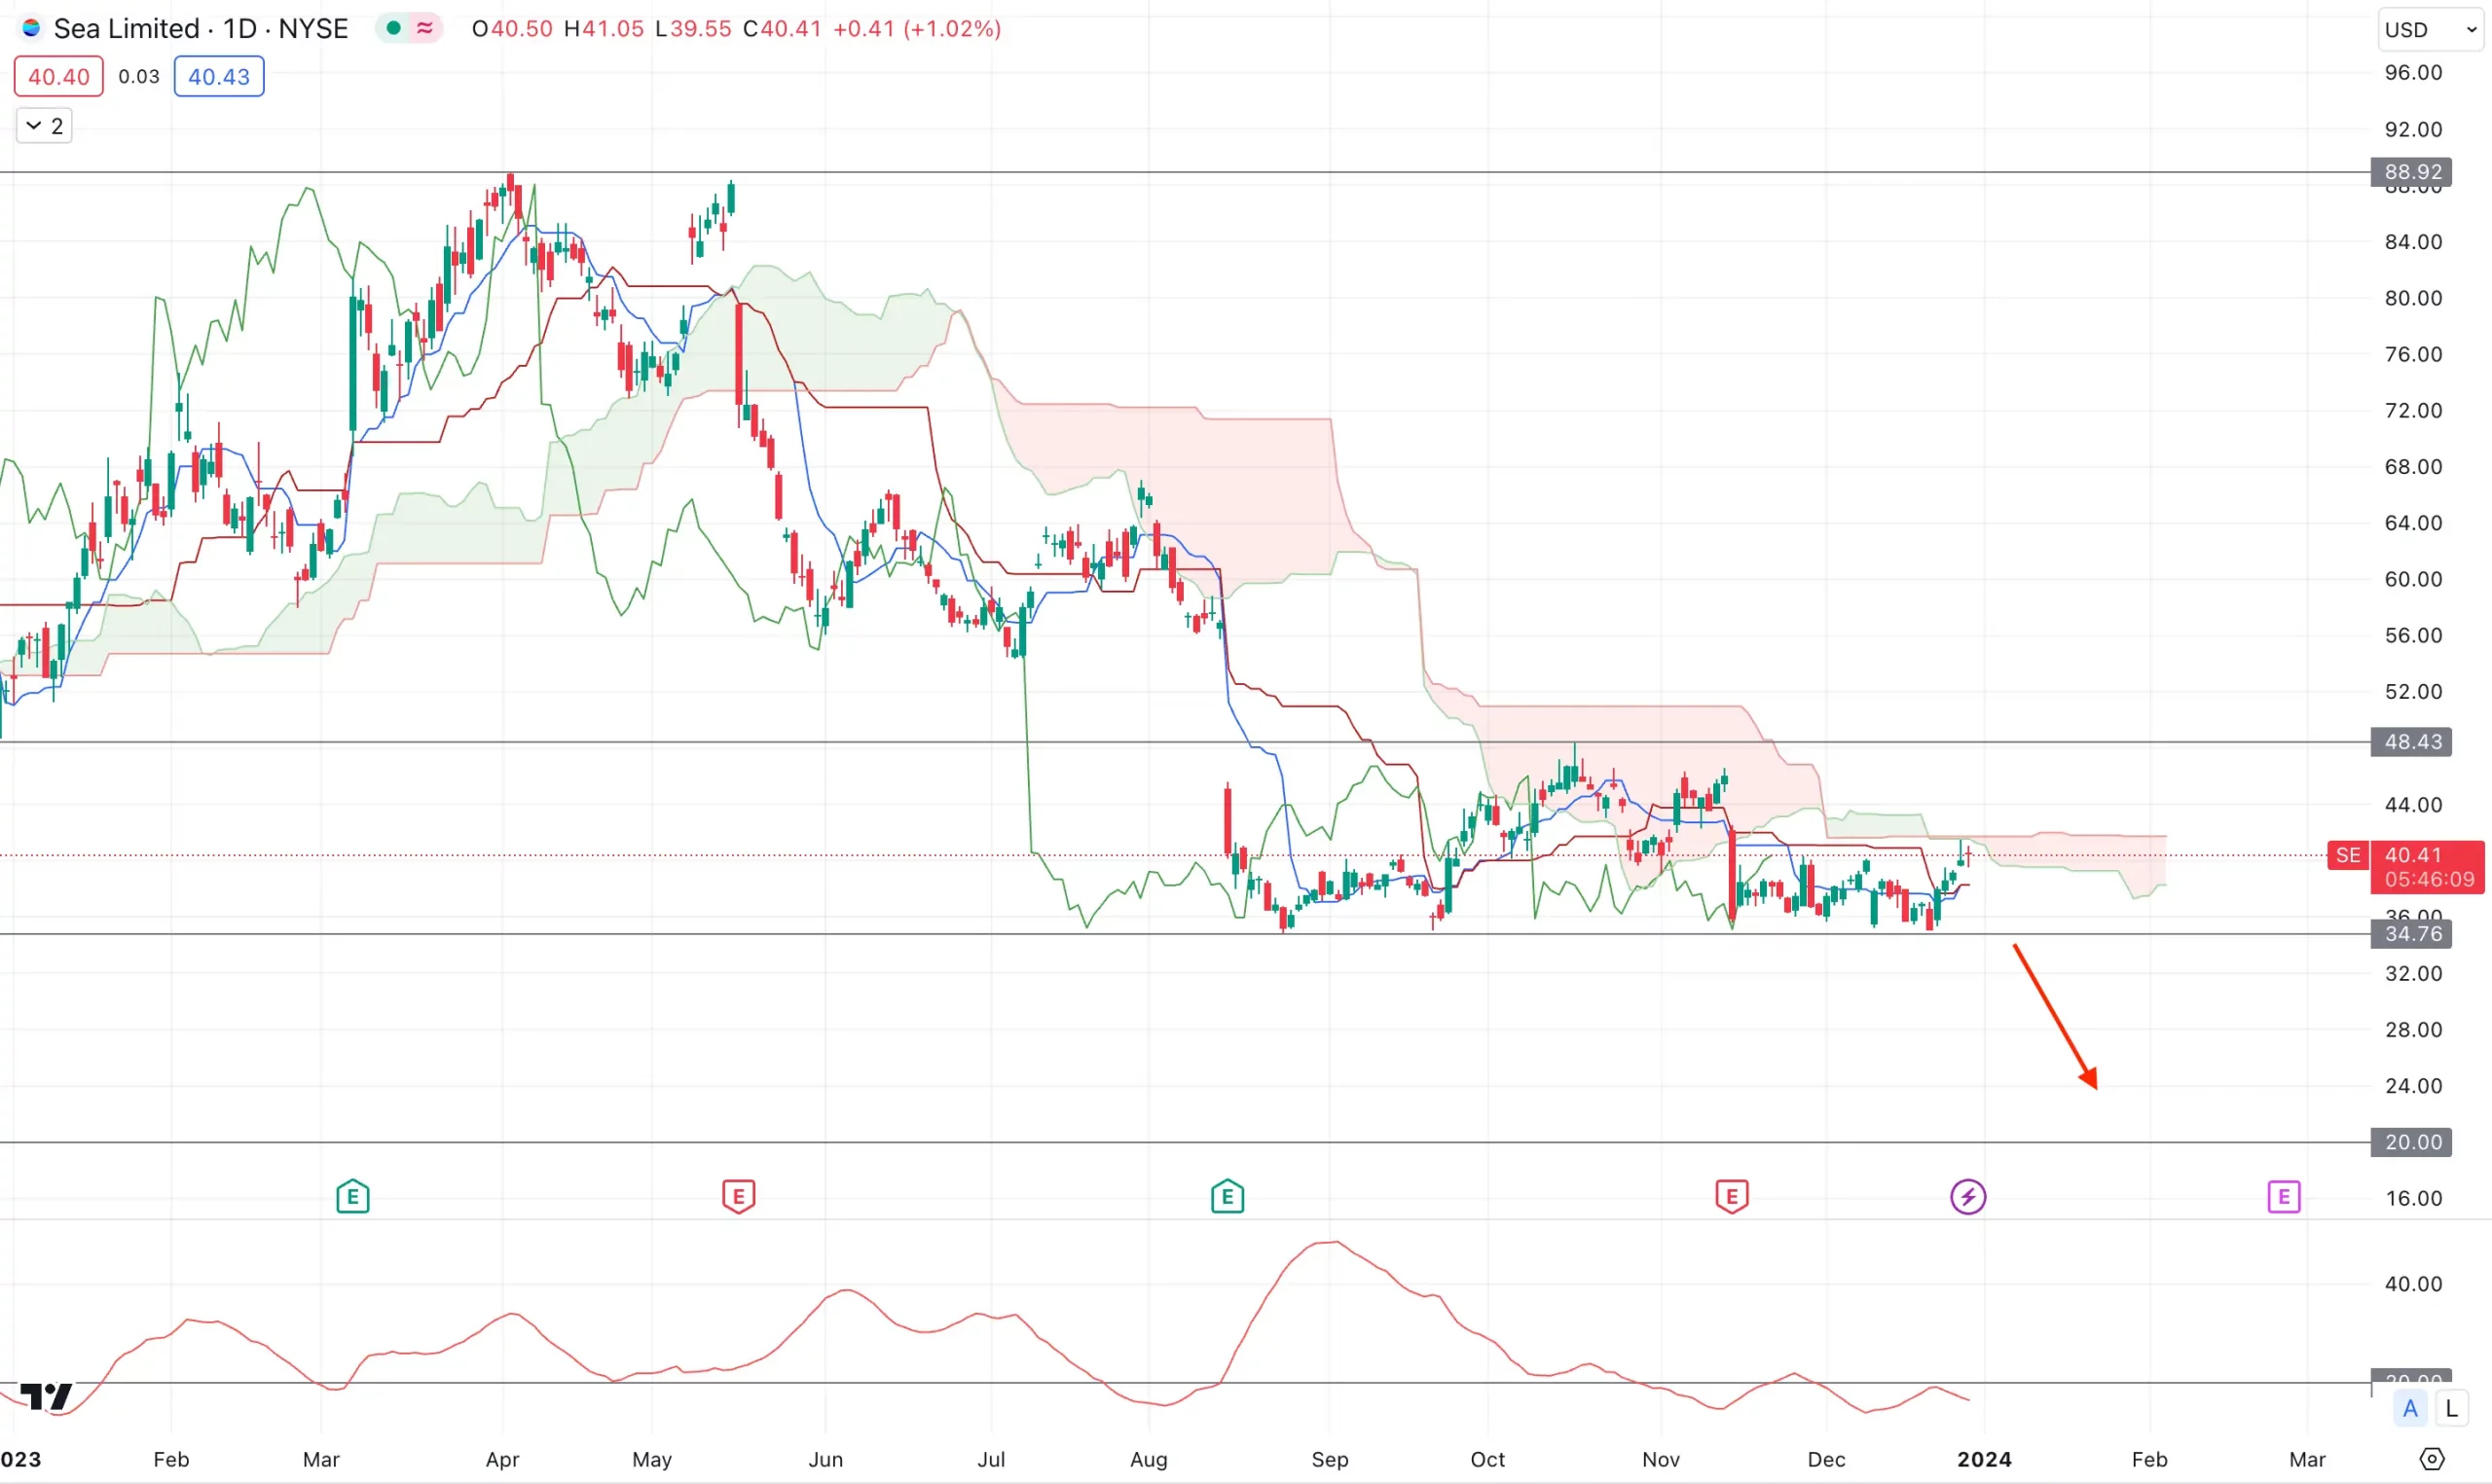
The daily chart shows the recent price trades below the Ichimoku Cloud zone with a corrective momentum, indicating a bearish redistribution.
Moreover, Senkou Span A remains below Senkou Span B with a downward slope, suggesting an upcoming downward continuation in the price.
In the secondary window, the current Average Directional Index (ADX) remains below the 20.00 line, which is a sign of corrective market pressure.
In this context, a bearish daily close below the 34.76 level with a rebound in ADX above the 20.00 line could be a strong short opportunity in this stock.
Below this crucial support, an open space is present with the next level at the 20.00 psychological level.
On the bullish side, a strong bullish breakout above the 48.43 level with a counter-impulsive momentum is needed before aiming for the 88.92 resistance level.
Sea Limited Stock Could Rebound From The Channel Breakout
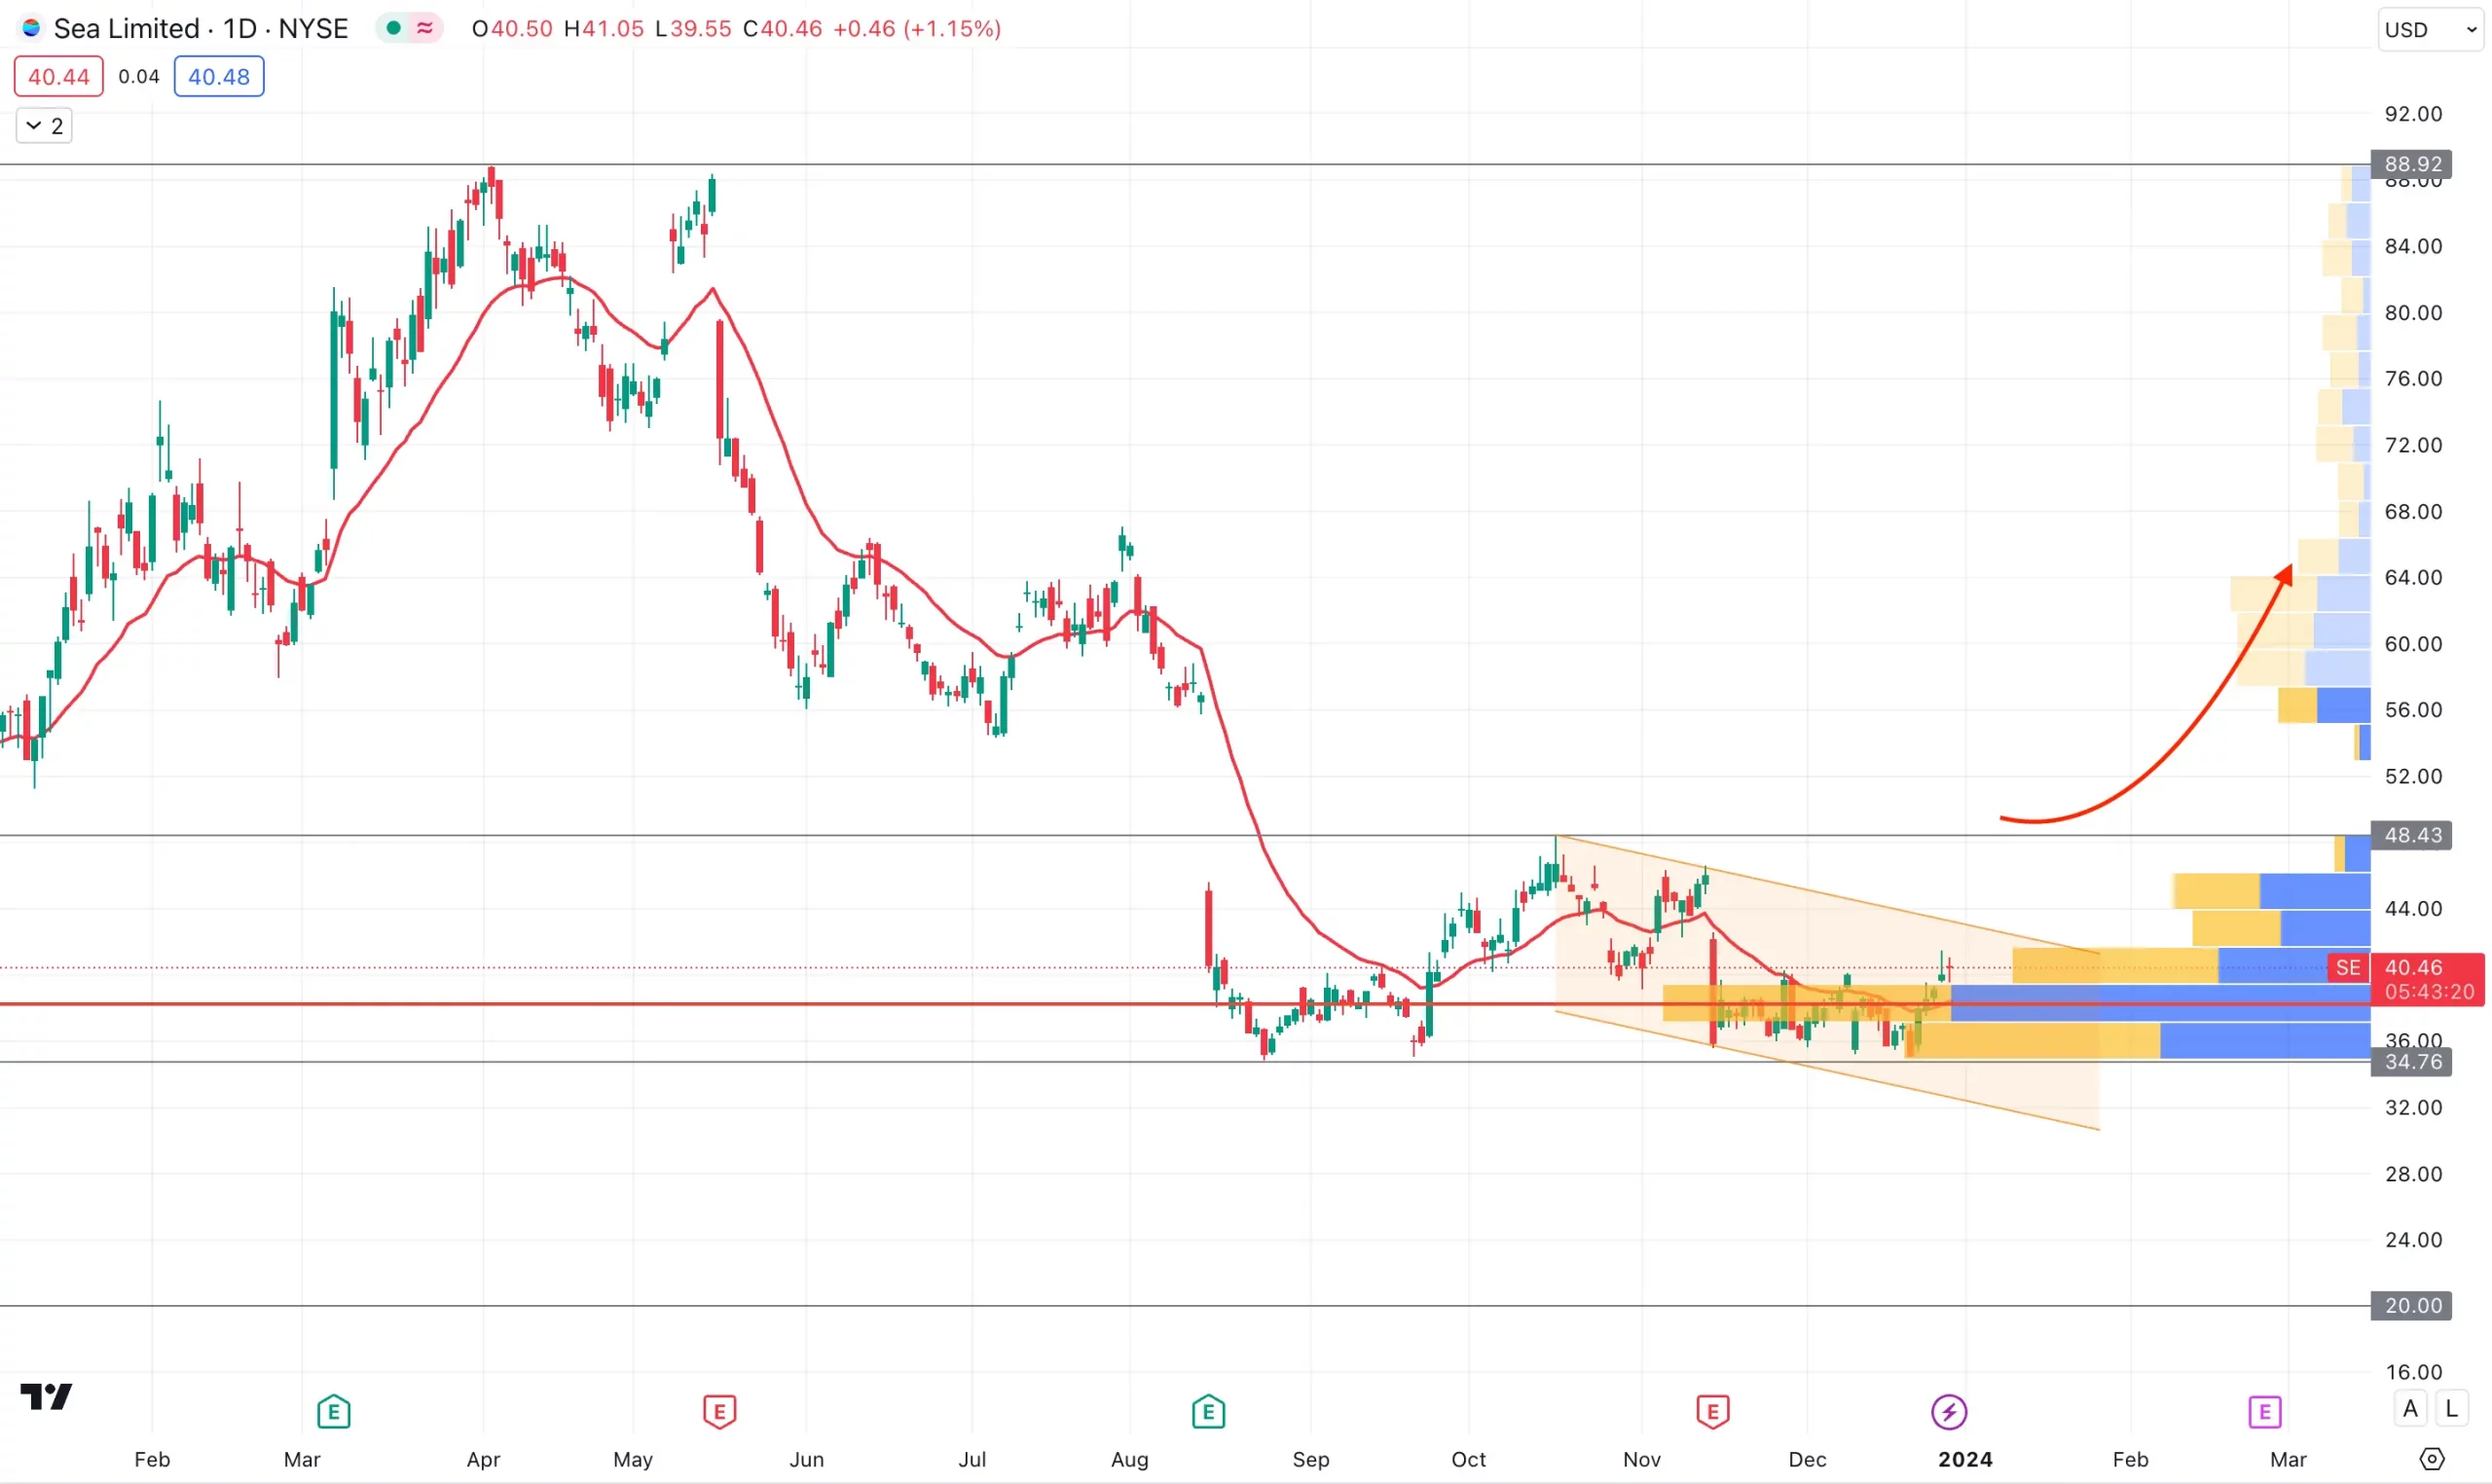
In the daily chart, the current bearish trend is corrective as it trades within a descending channel.
However, the most recent price remains bullish above the dynamic 20-day EMA, with no sign of strong buying pressure.
In the visible range high volume level, the most active level was at the 38.45 level, which is below the current price.
However, the recent MACD Histogram has an upward slope below the neutral line.
Based on the daily outlook of SE, a bullish channel breakout could be a long term bullish opportunity in this stock.
In that case, a daily candle above the 48.43 level with a consolidation could increase the price toward the 88.72 level.
$SE #SE Beautiful falling wedge w/ a strong weekly candle close this week.
Definitely one to put on the watchlist into 2024. pic.twitter.com/ODkt1JYl8P
— Jake Wujastyk (@Jake__Wujastyk) December 22, 2023
Is Sea Limited Stock A Buy?
Based on the current scenario, Sea Limited Stock (SE) trades within the sellers’ zone without a bullish reversal.
In that case, investors should closely monitor how the price reacts within the descending channel, as a bullish breakout could be the primary sign of a bull run.
Overall, it does seem like $SE stock is close to bottoming — indicating it could soon recover some of its previous losses.
Disclaimer: this is not financial advice. Please consult a licensed financial advisor prior to investing.


