Our bullish uranium is now confirmed. After the secular breakout in spot uranium, the uranium mining space broke out on January 10th, 2024. The uranium market outlook 2024 continues to be very bullish.
The uranium market will heat up in the coming months.
Note that this article was originally written in the summer of 2023. We add up to date charts so readers can see market development, heading into the big uranium breakout. We indicate the date of the latest chart update.
Back in the summer of 2023, we wrote this:
We change our uranium market outlook from ‘bullish bias’ to ‘bullish’. Our uranium market outlook 2023 & 2024 has the potential to become very bullish, with explosive upside potential in a select few uranium stocks which will only happen once spot uranium moves above 60USD/Lbs and URA ETF above 30 points.
We start our uranium market outlook 2024 with a review of the uranium spot chart, in a top down fashion: from the longest timeframe (monthly since 2008) to the daily chart over the last 5 years. We continue with a similar top down view on uranium’s sector ETF. Both are leading indicators, meant to understand the primary trend of the uranium market in 2024 (a forecast for 18 months roughly).
We look at the uranium market outlook in 2024 based on 2 leading indicators, on multiple timeframes:
- Uranium market outlook: indicator #1.
- Uranium market outlook: indicator #2.
- Uranium market outlook 2024.
- Uranium stocks – selection of top stocks.
Uranium market outlook – leading indicator #1
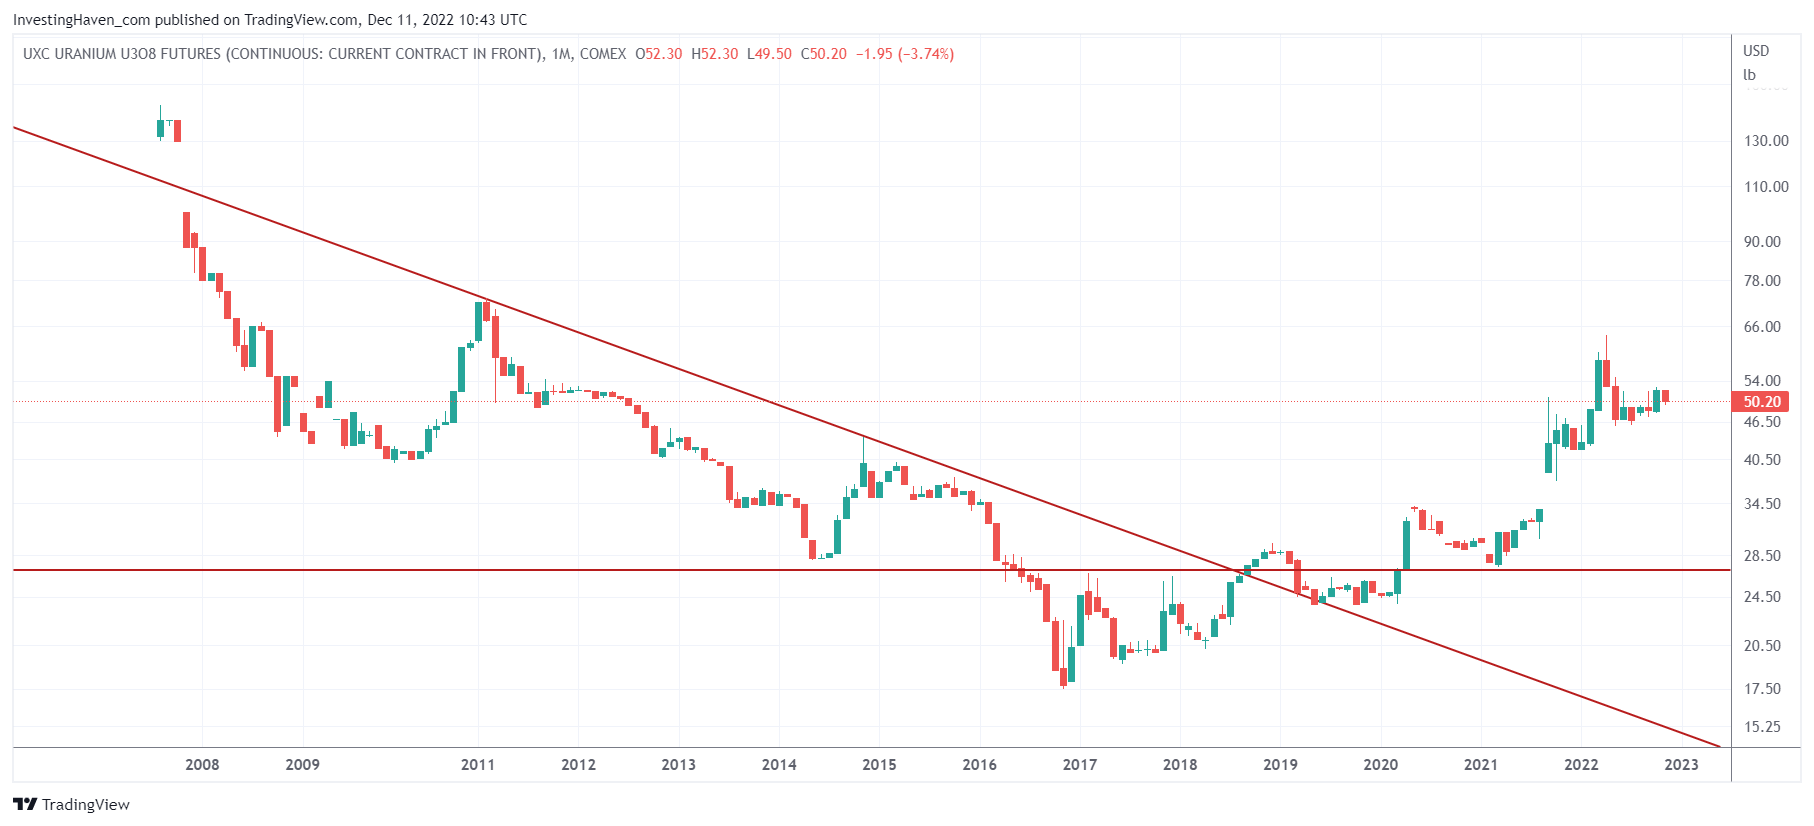
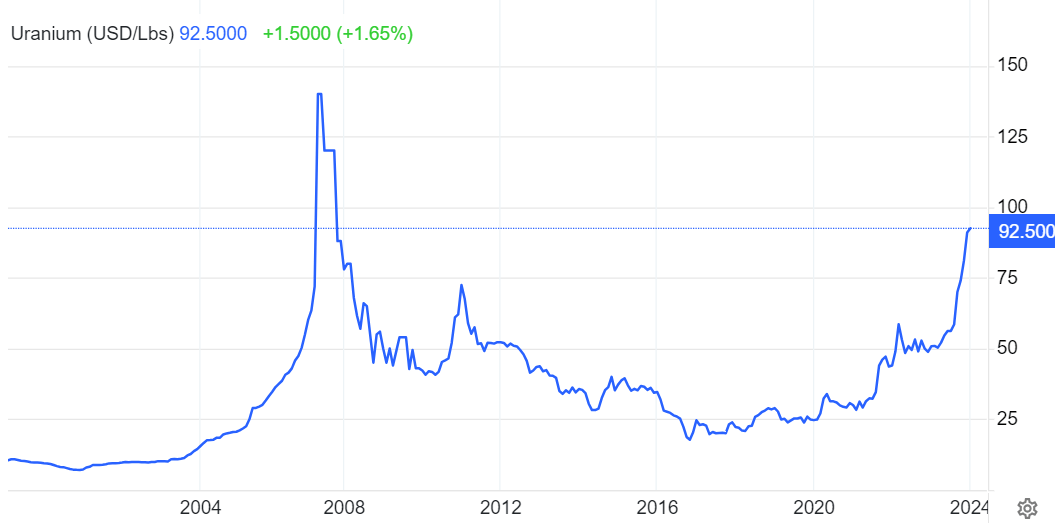
The longest term uranium price chart has a bullish reversal with 3 key levels: 55, 90 and 103 USD/Lbs. No surprise, uranium spot has shown hesitation which took the shape of a consolidation of 18 months, in the 50 to 60 area.
We do emphasize the duration of 18 months. This is a period in which many investors tend to leave the market, seemingly not interested because ‘their uranium positions are not performing’ (which is how they tend to think of it and express it).
The reality is, as per our 1/99 Investing Principles, that most investors tend to leave a quiet market. However, it is a happy few that hold strong to their positions as they realize a flat and quiet market is the basis for a powerful uptrend.
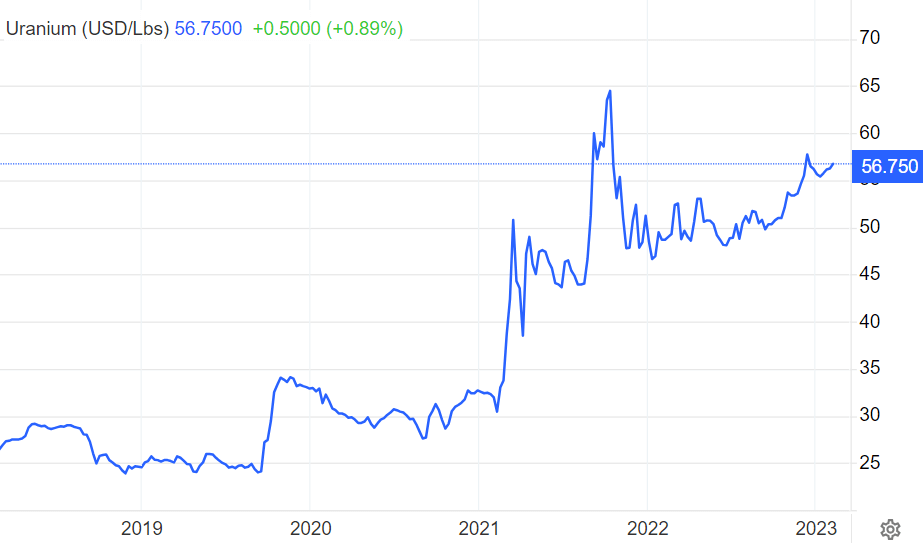
This is what we said in January of 2023, based on the monthly spot chart shown below: “We firmly believe that our uranium market outlook 2023 will turn bullish once uranium spot is able to clear 60.”
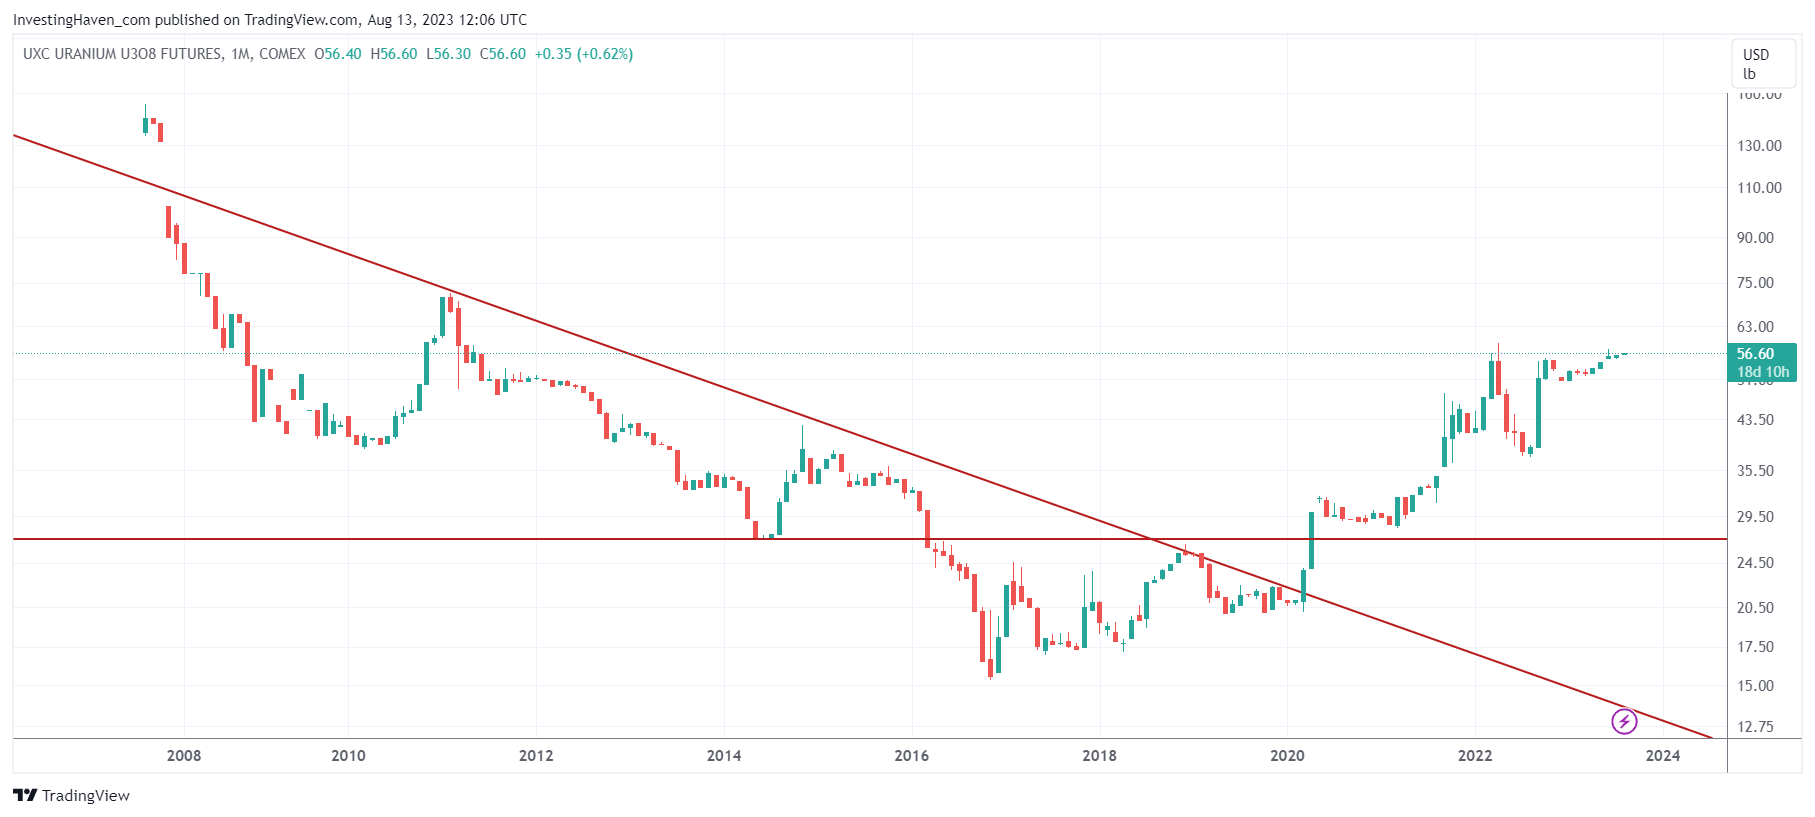
This is what we say in August of 2023, based on the up-to-date data points in the uranium market: “We firmly believe that our uranium market outlook 2023 & 2024 is officially turning bullish as uranium spot is slowly but surely preparing a move above 60 USD/Lbs (to be confirmed any time soon).”
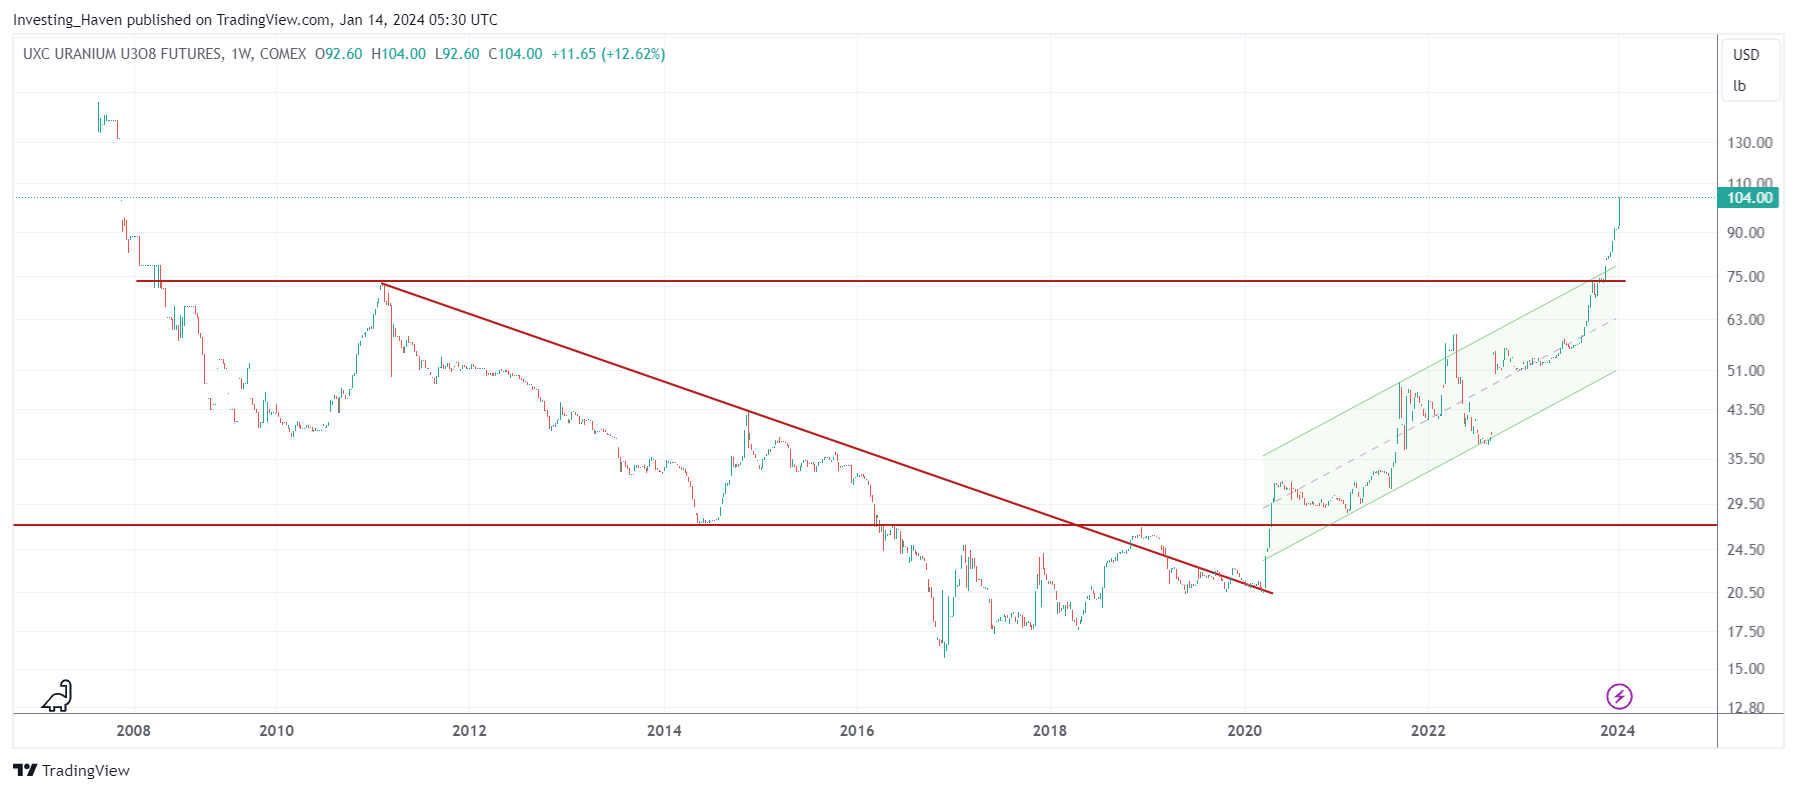
Update on January 13th, 2024: the breakout started well before 2024.
We zoom into the spot uranium chart, and add this 5-year chart version on August 13th, 2023. The pattern is a bullish reversal, the 18-month reversal we mentioned above. This is a bullish structure unless it sets a double top around 63-65 (low probability but always a possibility).
Update on January 13th, 2024: the secular chart of spot uranium is tremendously bullish.
Uranium market outlook – leading indicator #2
We take a look at the uranium stock sector based on the URA ETF. We start with the weekly uranium sector chart.
This is what we wrote in January of 2023, as commentary with the chart embedded below:
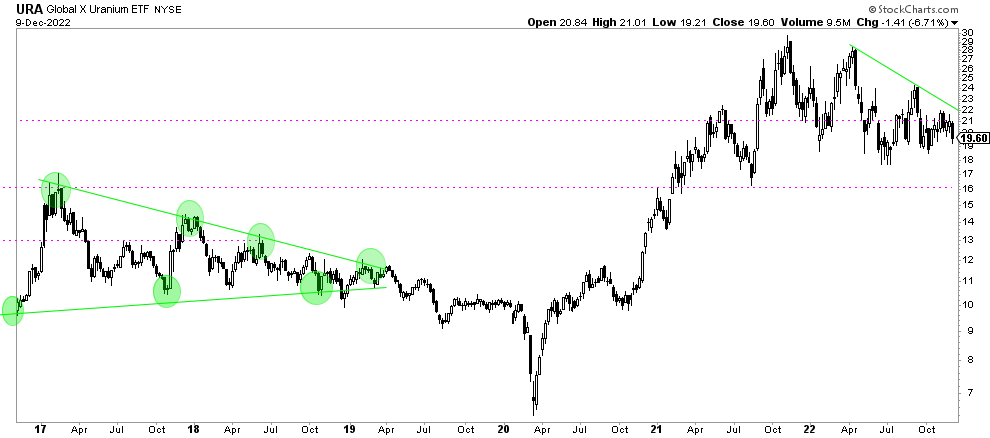
As seen, the weekly URA ETF chart has a series of lower highs. This, in and on itself, is bearish. However, it might be part of a bullish reversal if key support holds and once the falling resistance trend is cleared.
For now, we watch the 17 – 18 area. This is important support. If this market wants to work toward a bullish outcome in 2023 it must respect support and start clearing this falling 2022 trendline.
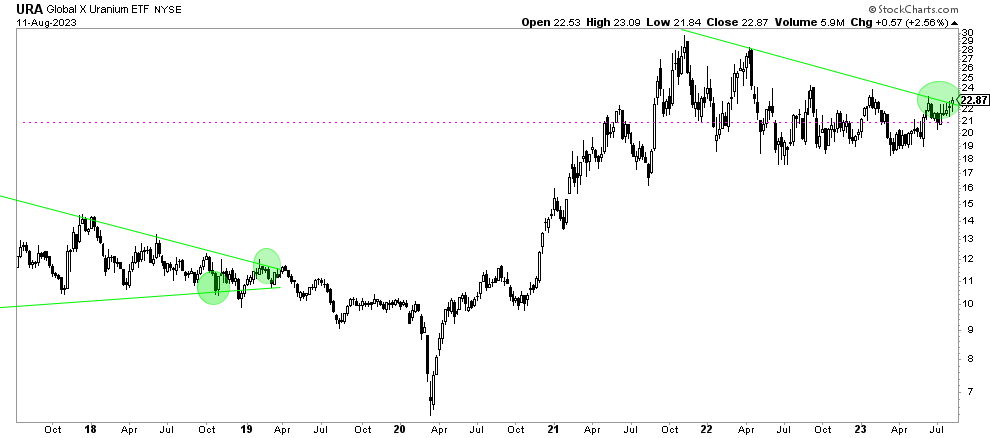
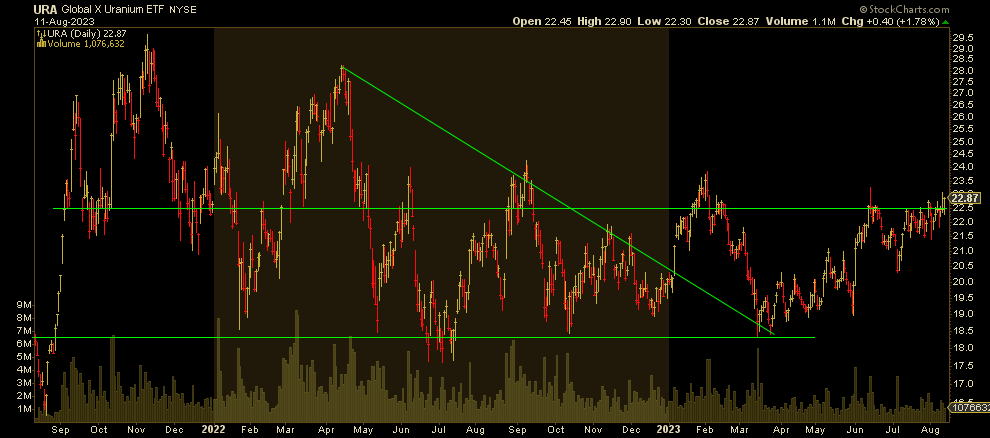
On August 13th, 2023, it is getting clear how the chart setup is slowly but surely turning much more constructive. The long term consolidation starts taking the shape of a bullish reversal with the breakout above the 2-year falling trendline.
Let’s zoom in and look at the daily URA chart.
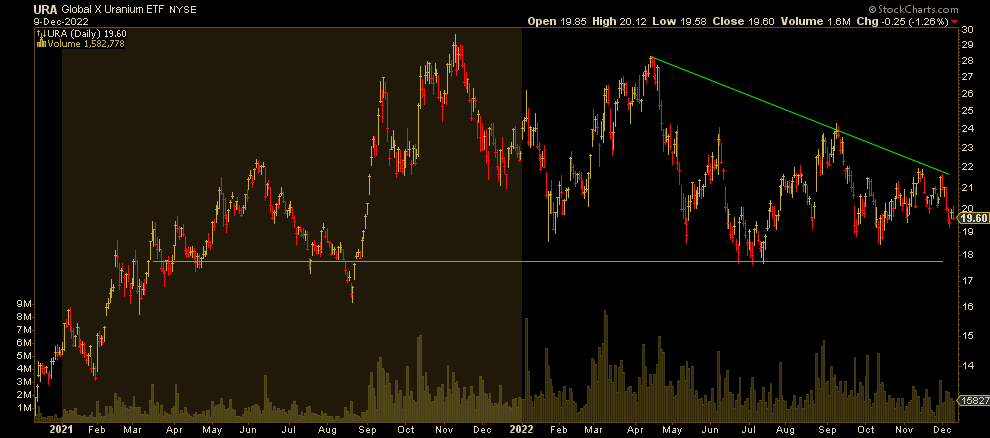
Below is a close-up of the ongoing pattern that we labeled as ‘a series of lower highs’. Commentary from January of 2023/
Moreover, and equally important for our uranium market outlook 2023, is the falling trendline that originated in April of 2022. At this very point in time, the setup is more of a bearish triangle. However, if the falling trendline can be cleared, it can turn into a bullish reversal structure.
Fast forward to August, we see primarily how support was perfectly respected in March & April of 2023. The big test now is to get through the 22.2-23.3 area, in the weeks and months to come.
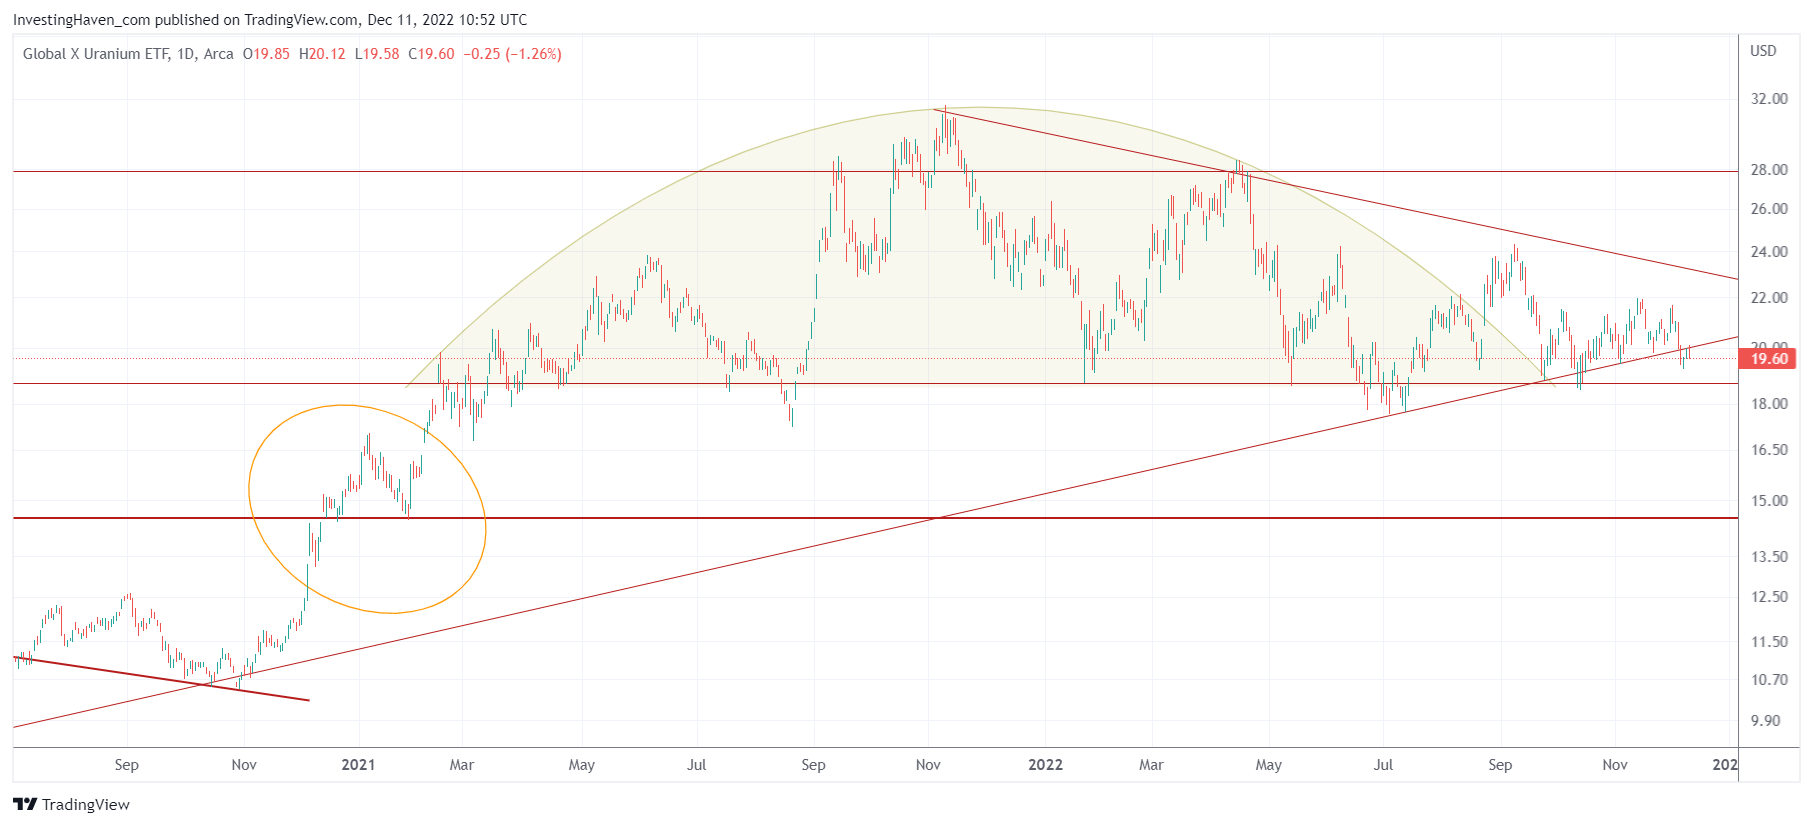
We look at the same daily URA chart with a different charting tool.
Commentary from January/2023:
What we observe is that there is also a rising trendline that started in the Corona crash period and turned into support in November of 2020. This trendline is thoroughly being tested right now.
The uptrend line was adjusted, slightly, in H1/2023. More importantly, the 50% retracement level, by far the most important level in any consolidation, is being tested at the time of writing.
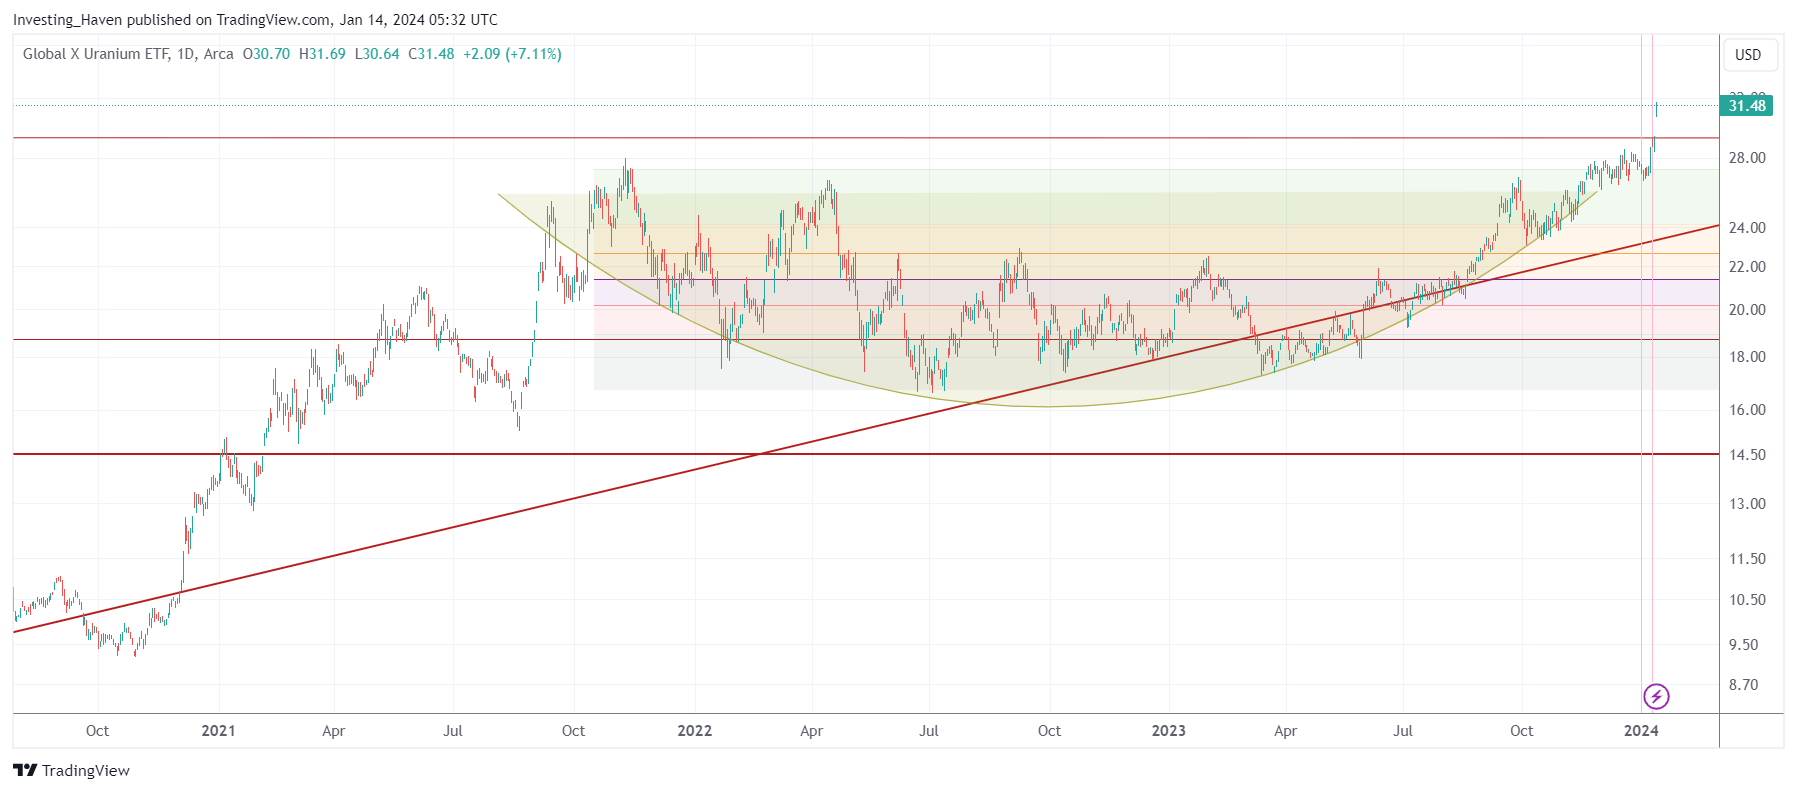
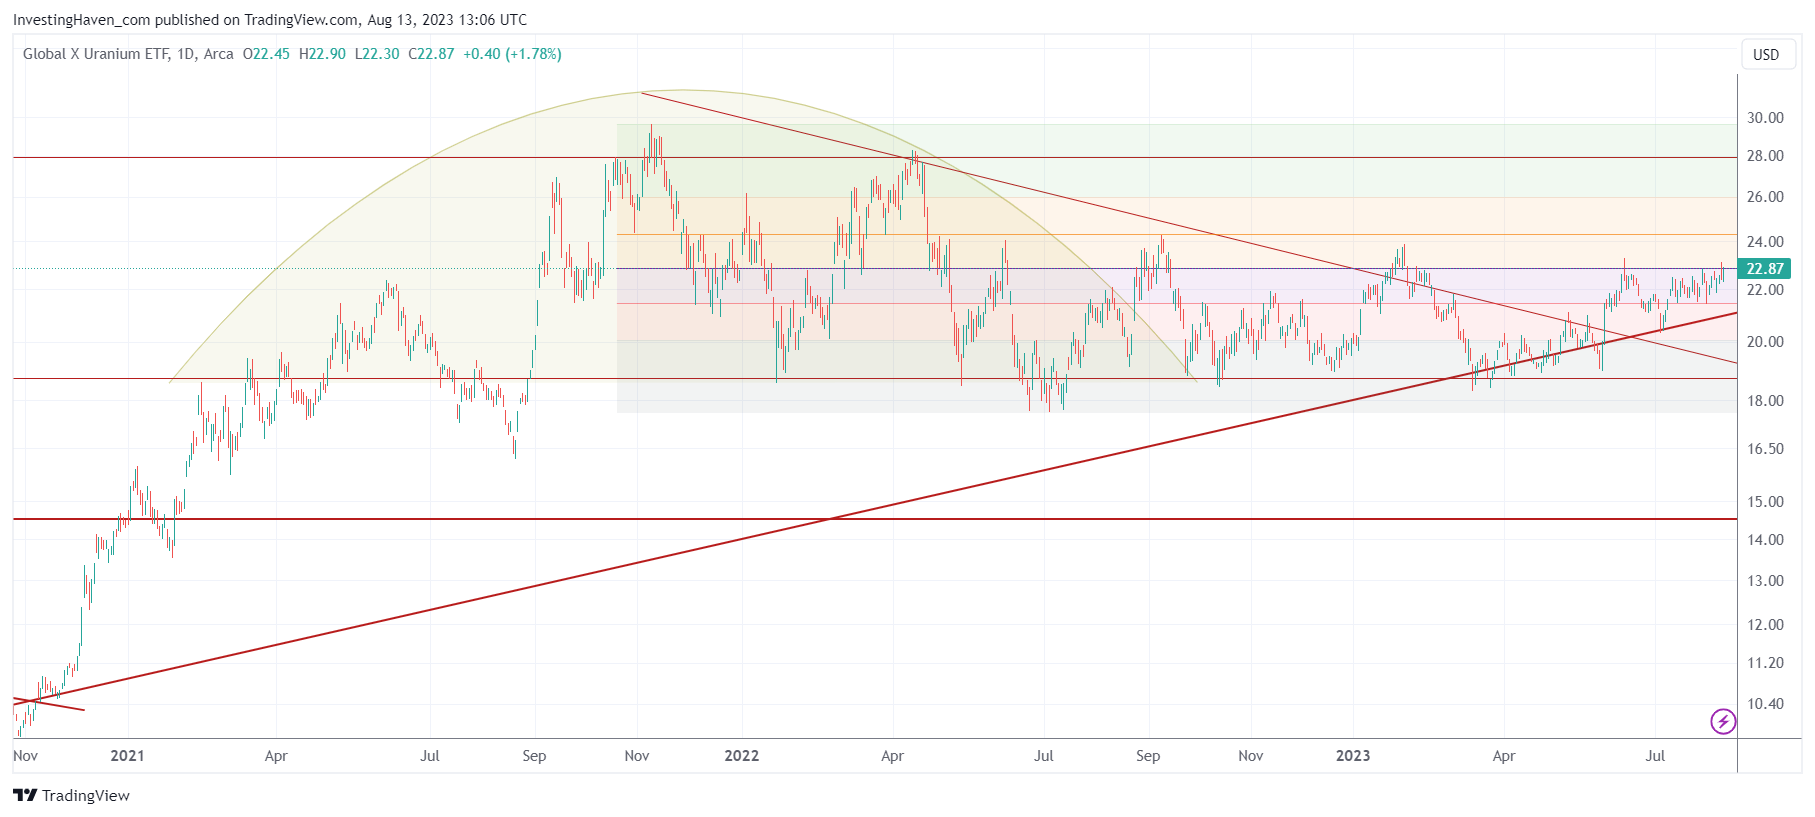 Update on January 13th, 2024: the breakout started on one of the two days that we shared with premium members of the Momentum Investing service, see pink horizontal line. This is a major breakout in uranium stocks.
Uranium market outlook 2024
In January of 2023, we concluded:
It is clear why we summarize our uranium market outlook 2023 as follows: “The uranium market has a bullish bias in 2023, however both the price of uranium and uranium stocks must prove their ability to clear resistance.” The uranium market is at a pivot point right now. There is no way of knowing exactly if it will move higher or find resistance here even though the bias continues to be bullish. We would say: bullish bias until proven otherwise. The outcome will be wildly bullish or bearish, a pretty extreme outcome for our uranium market outlook 2023!
On August 13th, 2023, we conclude:
The uranium market has everything it takes to become bullish. Once URA ETF clears the 22.2-23.3 area, on a 5 day closing basis, and spot uranium moves above the 62-65 area, we expect an acceleration in the uptrend. Between now and then, our uranium market outlook 2024 becomes bullish (from a bullish bias assessment early on in 2023). Once the above criteria are met, we will turn very bullish.
On January 13th, 2024, we conclude:
The breakout in spot uranium was confirmed a few months before 2024 kicked off. Uranium miners confirmed their breakout on January 10th, 2024.

