Investing Haven
No Result
View All Result
Gold Silver Investing >>
CRYPTO INVESTING >>
  • 2025 Forecasts
    • 10 market predictions
    • Dow Jones forecast
    • S&P 500 forecast 2025
    • Nasdaq prediction 2025
    • Best altcoins to buy
    • Best crypto to buy now
    • Which crypto will explode
    • 15 crypto forecasts 2025
    • Which precious metal to buy
  • Silver
    • Silver prediction 2025 – 2030
    • Will silver exceed $30?
    • When will silver hit $50?
    • Can silver hit $100?
    • Silver shortage
    • 50-year silver chart
    • Silver bullish reversal
    • Silver seasonality charts
    • How to invest in silver
  • Gold
    • Gold prediction 2025 – 2030
    • Will gold set new ATH?
    • Will gold hit $3,000?
    • Can gold hit $10,000?
    • Gold chart 10 years
    • Gold chart 50 years
    • Gold chart 100 years
    • Gold silver ratio
    • Gold seasonality charts
  • Commodities
    • Coffee forecasts
    • Sugar forecasts
    • Nickel forecasts
    • Lithium investing
  • Crypto forecasts
    • BTC prediction 2025 – 2030
    • ETH prediction 2025 – 2030
    • SOL prediction 2025 – 2030
    • XRP prediction 2025 – 2030
    • XLM prediction 2025 – 2030
    • BNB prediction 2025 – 2030
    • ADA prediction 2025 – 2030
    • AVAX prediction 2025 – 2030
    • KAS prediction 2025 – 2030
    • NEAR prediction 2025 – 2030
    • BCH prediction 2025 – 2030
    • LINK prediction 2025 – 2030
    • DOT prediction 2025 – 2030
    • SUI prediction 2025 – 2030
    • ICP prediction 2025 – 2030
    • LTC prediction 2025 – 2026
    • STX prediction 2025 – 2030
    • DOGE prediction 2025 – 2030
    • SHIB prediction 2025 – 2030
    • PEPE prediction 2025 – 2030
    • FLOKI prediction 2025 – 2030
    • WIF prediction 2025 – 2030
    • ONDO prediction 2025 – 2030
  • News
    • Crypto news
    • Commodities
  • Login
Investing Haven
No Result
View All Result

Home » Gold » 10 Year Gold Price Chart. A Very Bullish Pattern!

10 Year Gold Price Chart. A Very Bullish Pattern!

The gold price over the last 10 years has a stunning pattern.

Taki T. by Taki T.
January 1, 2025
in Gold
10 year gold price chart
3.4k
VIEWS
Share on FacebookShare on Twitter

This article has a stunning 10-year gold price chart which puts the new gold bull market in perspective.

The 10-year gold chart with our chart annotations helps readers understand the message of the chart.

It’s a bullish message.

Gold price chart – the big picture

One of the best practices of reading charts is the top down approach – start with a higher timeframe.

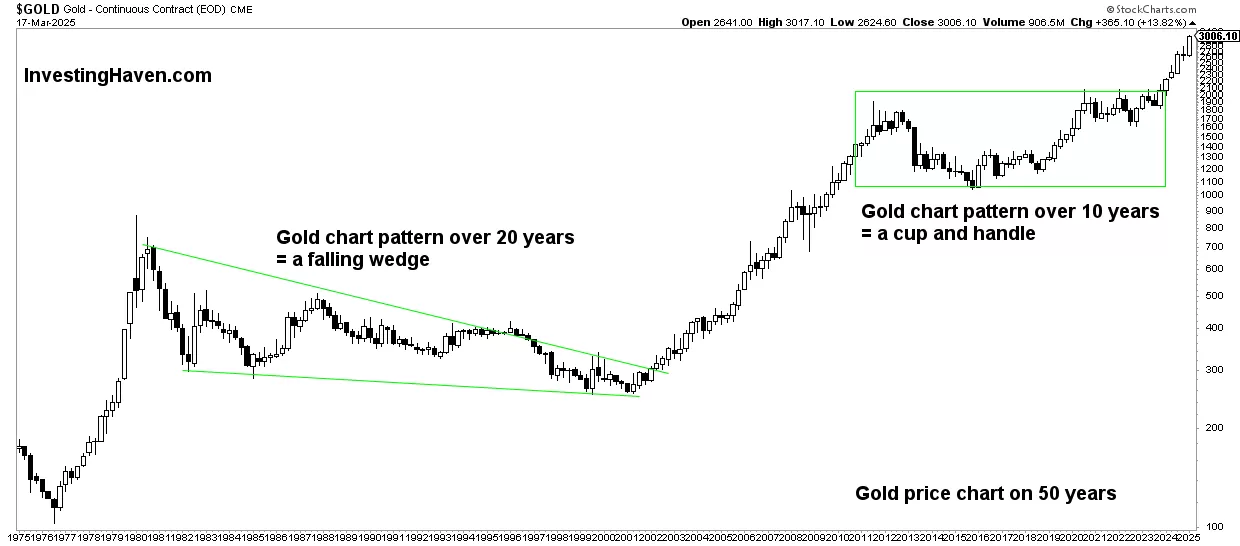
  • We first look at the 50-year gold chart.
  • On there, we find the structure of the gold price over 10 years.

Gold’s The big picture timeframe is the 50 year gold chart shown below.

READ – Gold prediction 2025

That’s where big picture (dominant) chart patterns become visible. What do we see?

  • A falling wedge that took 20 years to complete (1980-2001).
  • A secular uptrend (2001-2011).
  • A consolidation in the form of a cup and handle formation that took 10 years to complete (2013-2023).

The latter is the important insight to take into account when analyzing the gold price on 10 years.
gold price 50 years
Long term gold price chart

It took the gold market exactly 10 years to complete a bullish chart formation, a basing pattern:

  • This period has felt very uncertain to most gold investors.
  • The broader investor public did challenge the gold thesis.
  • However, the long term gold chart was very clear.

That’s why chart pattern and accurate chart readings are so important – the break through the noise. Much of the noise is created by gold news that tends to contain information that is irrelevant to the investor. Equally important is to emphasize that gold charts without patterns and structure are meaningless.

Moreover, it’s only long term charts that can offer valuable insights. In a world focused on short term gold price changes, with hashtags and cash tags, it is challenging to see the big picture clearly.

Gold price chart on 10 years: dominant pattern

The reason we started analyzing the historical gold chart (above) is to find the dominant pattern on the 10-year gold chart.

Strictly speaking, the 10-year chart goes back to 2014. That’s the problem.

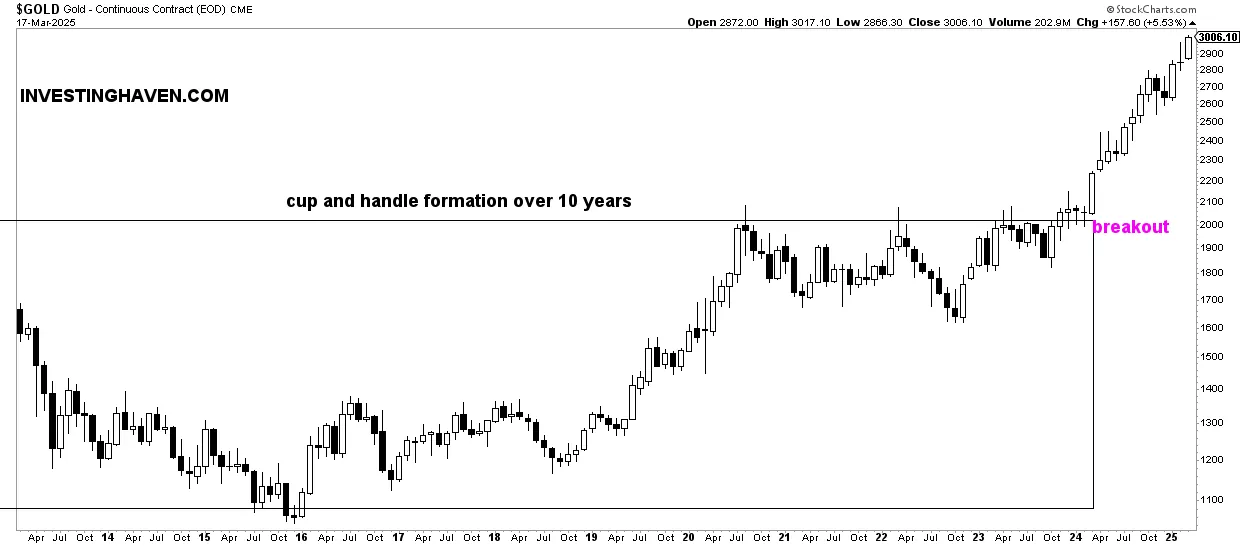
The dominant pattern, cup and handle formation, a bullish one, started in December of 2012. A regular 10-year gold chart would not capture the ultra bullish chart pattern.

That said, it is clear from our chart annotations how gold required 10 years to complete a long term chart pattern. It’s a bullish pattern.

A few notes from gold’s 10-year price chart:

  1. The pullback with mid-point 2015 was deep. This resulted in a powerful bullish reversal.
  2. It took gold 8 years to get back to the initial level from back in 2012.
  3. The 3-year consolidation since 2020 created a solid support structure – it felt uncertain for sure.

The above points contribute to the powerful nature of the subsequent breakout.
Gold price chart 10 years

Consequently, the breakout that occurred in 2024 is a bullish secular breakout.

While gold may retrace, re-test its breakout level around $2,100, it is likely going to qualify as a bullish back-test. 

Gold price chart on 10 years: quarterly cycles

One often overlooked dynamic are the short term cycles.

They can help investors tremendously;

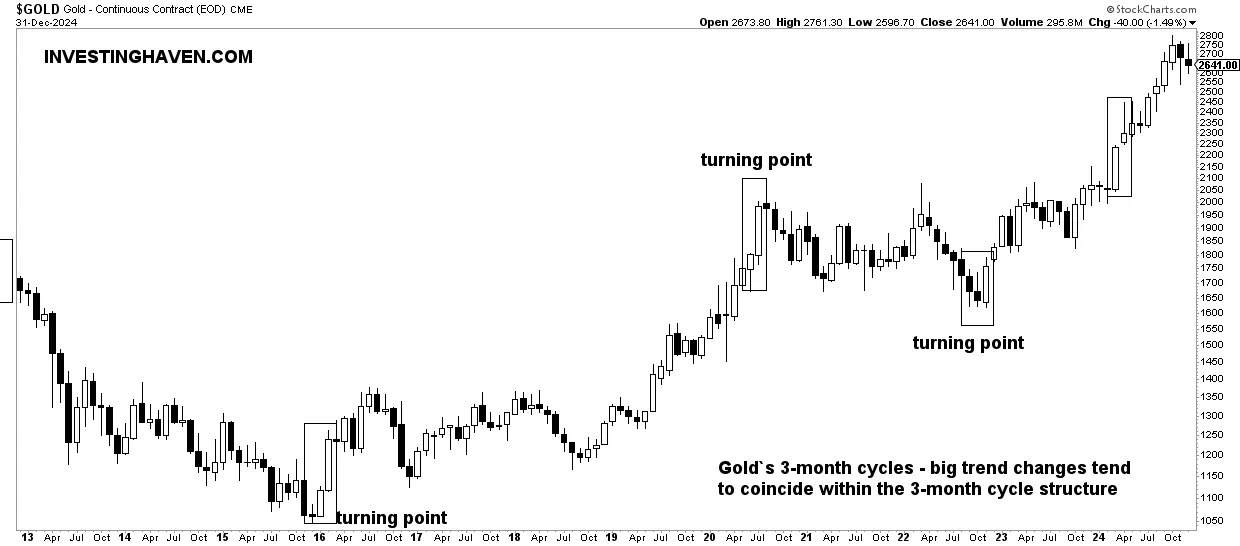
As seen on this 10-year gold chart, we annotated the quarterly cycles with boxes.

Why this matters? The quarterly cycles help us understand turning points, trend changes, which comes with crucial information for investors.
gold price chart with cycles
Gold price chart with cycles and turning points

Again, these quarterly cycles are not available on regular gold charts, also not visible to regular readers.

That’s why we frequently cover these quarterly cycles in our premium gold & silver market reports.

Conclusions from gold’s 10-year price chart

While the 10-year gold chart may look very exciting at first glance, the reality is that it has a treasure of insights.

The point is this – charts without annotations are mostly noisy.

Certainly a volatile market like gold requires decent chart annotations.

That said, the key findings from gold’s 10-year chart:

  • A bullish long term pattern concluded in 2023 (arguably, early 2024).
  • This bullish pattern is called a ‘cup and handle’.
  • The breakout of 2024 is ‘the real deal’.
  • While gold may re-test its breakout level, somewhere in 2024, it is clearly set to move higher in 2025 and beyond.

Charts don’t lie.

The 10-year gold price chart does not lie.

Gold has a bullish long term setup.

10-YEAR ANNIVERSARY OFFER: InvestingHaven.com celebrates 10 years. Temporarily, you can enjoy a discount on our premium gold/silver and crypto reports. Or you can become a VIP member. Go to our anniversary deals >>
Receive our weekly newsletter.

premium service SP-500 premium service trade alerts premium service crypto teaser 

No related posts.

Tags: GOLDhistorical charts
Taki T.

Taki T.

Taki is a chart analyst who is passionate about unlocking unique insights out the chart. While the vast majority of analysts remain focused on price analysis, Taki starts with timeline analysis and adds price analysis to this. In doing so, he developed a unique methodology to find opportunities in financial markets, across assets and markets.

Connect with InvestingHaven

Receive top notch forecasts for free.

*We hate spam as you do.

Site Navigation

  • RSS Feed
  • About us
  • Advertising
  • Sponsored Content Policy
  • Mission 2026
  • Sitemap
  • Privacy & Disclaimer
  • Terms of Service
  • Contact Us
investing haven logo

Precious metals market analysis including gold and silver price predictions. Crypto market analysis including highly accurate BTC ETH SOL XRP forecasts.

Copyright © 2025 InvestingHaven

Login to your account below

Forgotten Password?

Fill the forms bellow to register

All fields are required. Log In

Retrieve your password

Please enter your username or email address to reset your password.

Log In
No Result
View All Result
  • News
  • 2025 Forecasts
    • 10 market predictions
    • Dow Jones forecast 2025
    • S&P 500 forecast 2025
    • Nasdaq prediction 2025
    • Best crypto to buy now
    • Which crypto will explode
    • Best altcoins to buy
    • 15 crypto forecasts 2025
    • Which precious metal to buy
  • Silver articles
    • Silver prediction 2025 – 2030
    • Will silver exceed $30?
    • When will silver hit $50?
    • Can silver hit $100?
    • Silver shortage
    • 50-year silver chart
    • Silver bullish reversal
    • Silver seasonality charts
    • How to invest in silver
  • Gold
    • Gold prediction 2025 – 2030
    • Will gold set new ATH?
    • Will gold hit $3,000?
    • Can gold hit $10,000?
    • Gold chart 10 years
    • Gold chart 50 years
    • Gold chart 100 years
    • Gold silver ratio
    • Gold seasonality charts
  • Commodities
    • Sugar forecasts
    • Coffee forecasts
    • Nickel forecasts
    • Lithium investing
  • Crypto news
  • Crypto forecasts
    • BTC prediction 2025 – 2030
    • ETH prediction 2025 – 2030
    • SOL prediction 2025 – 2030
    • XRP prediction 2025 – 2030
    • XLM prediction 2025 – 2030
    • BNB prediction 2025 – 2030
    • ADA prediction 2025 – 2030
    • AVAX prediction 2025 – 2030
    • KAS prediction 2025 – 2030
    • NEAR prediction 2025 – 2030
    • BCH prediction 2025 – 2030
    • LINK prediction 2025 – 2030
    • DOT prediction 2025 – 2030
    • SUI prediction 2025 – 2030
    • ICP prediction 2025 – 2030
    • LTC prediction 2025 – 2026
    • STX prediction 2025 – 2030
    • DOGE prediction 2025 – 2030
    • SHIB prediction 2025 – 2030
    • PEPE prediction 2025 – 2030
    • FLOKI prediction 2025 – 2030
    • WIF prediction 2025 – 2030
    • ONDO prediction 2025 – 2030
  • Premium Crypto Alerts
  • Premium services

Copyright © 2025 InvestingHaven