Investing Haven
No Result
View All Result
Gold Silver Investing >>
CRYPTO INVESTING >>
  • 2025 Forecasts
    • 10 market predictions
    • Dow Jones forecast
    • S&P 500 forecast 2025
    • Nasdaq prediction 2025
    • Best altcoins to buy
    • Best crypto to buy now
    • Which crypto will explode
    • 15 crypto forecasts 2025
    • Which precious metal to buy
  • Silver
    • Silver prediction 2025 – 2030
    • Will silver exceed $30?
    • When will silver hit $50?
    • Can silver hit $100?
    • Silver shortage
    • 50-year silver chart
    • Silver bullish reversal
    • Silver seasonality charts
    • How to invest in silver
  • Gold
    • Gold prediction 2025 – 2030
    • Will gold set new ATH?
    • Will gold hit $3,000?
    • Can gold hit $10,000?
    • Gold chart 10 years
    • Gold chart 50 years
    • Gold chart 100 years
    • Gold silver ratio
    • Gold seasonality charts
  • Commodities
    • Coffee forecasts
    • Sugar forecasts
    • Nickel forecasts
    • Lithium investing
  • Crypto forecasts
    • BTC prediction 2025 – 2030
    • ETH prediction 2025 – 2030
    • SOL prediction 2025 – 2030
    • XRP prediction 2025 – 2030
    • XLM prediction 2025 – 2030
    • BNB prediction 2025 – 2030
    • ADA prediction 2025 – 2030
    • AVAX prediction 2025 – 2030
    • KAS prediction 2025 – 2030
    • NEAR prediction 2025 – 2030
    • BCH prediction 2025 – 2030
    • LINK prediction 2025 – 2030
    • DOT prediction 2025 – 2030
    • SUI prediction 2025 – 2030
    • ICP prediction 2025 – 2030
    • LTC prediction 2025 – 2026
    • STX prediction 2025 – 2030
    • DOGE prediction 2025 – 2030
    • SHIB prediction 2025 – 2030
    • PEPE prediction 2025 – 2030
    • FLOKI prediction 2025 – 2030
    • WIF prediction 2025 – 2030
    • ONDO prediction 2025 – 2030
  • News
    • Crypto news
    • Commodities
  • Login
Investing Haven
No Result
View All Result

Home » Gold » Gold – Here Is When The Long Term Bull Market Will Be Confirmed

Gold – Here Is When The Long Term Bull Market Will Be Confirmed

Gold has seen flat trading this quarter. Here is gold's bullish case, and potential bearish case.

Taki T. by Taki T.
December 27, 2024
in Gold
gold price breakout
2.3k
VIEWS
Share on FacebookShare on Twitter

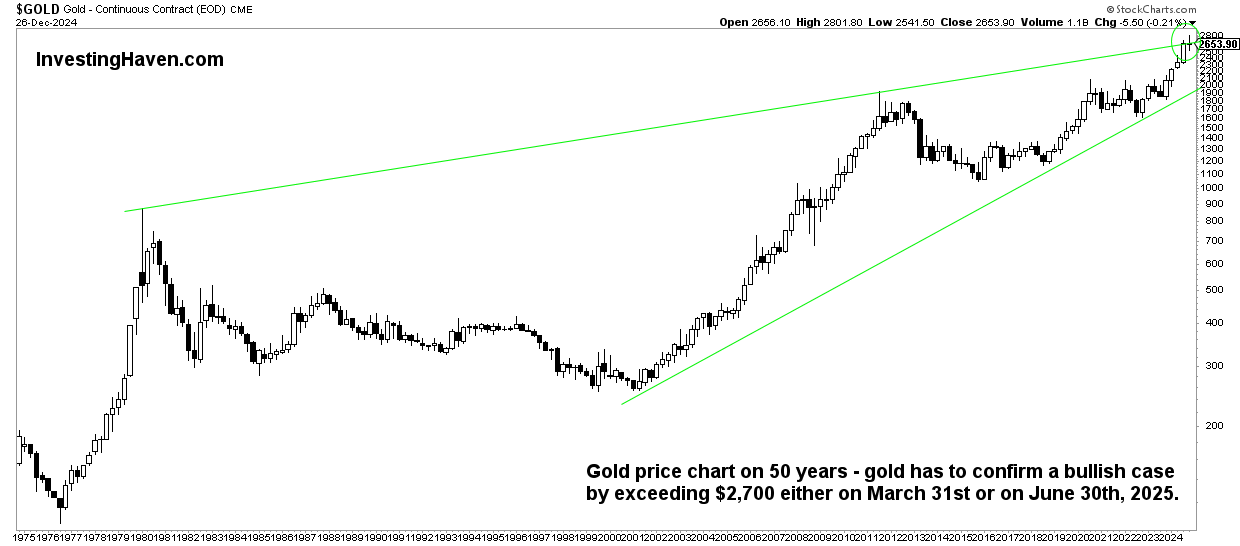
Gold will confirm its long term bull market once it exceeds $2,700 an Ounce either on March 31st or June 30th, 2025. It will be bearish if it drops significantly by those dates.

Gold has a beautiful long term chart.

  • We continue to see a great outcome for gold, ending up near $5,000 an Ounce at some point before 2030.
  • A detailed analysis on why we are bullish on gold with gold price targets near $5,000 can be found in our gold price prediction.

It is wise to always assess potential outcomes. That’s not only the expected outcome (bullish in the case of gold) but also the unexpected and not desired outcome (bearish in the case of gold).

Long term gold bull market on the 50-year chart

For clarity on the long term trend, we need to look at the longest timeframes. Below is the 50-year gold chart.

While many analysts focus on technical indicators or fundamental data points, we believe there is a much more effective way to assess trends – plain and pure chart analysis.

That’s because the chart reflects buy and sell decisions, not opinions nor expectations. Moreover, and this is very important, the nature of the pattern reveals consensus between buyers and sellers – a smooth chart pattern confirms consensus (the opposite is true as well).

That said, we turn on annotations on this long term gold chart and find one, and only one, pattern that truly matters to confirm gold’s long term bull market.

gold chart 50 years
gold chart 50 years

Long term gold bull market – confirmation

There is one important chart pattern visible on the long term gold chart – it’s a long term gold bull market pattern: the cup and handle.

What’s more important – the cup and handle on gold’s chart has a very long duration. Above all, it’s a smooth pattern.

The longer a pattern and the smoother a pattern, the higher the level of confidence and the more powerful.

In the case of gold, this long term smooth cup and handle, a bullish pattern by definition, adds to confidence that gold is experiencing a long term bull market.

As explained in great detail in Is Gold Expected To Set New ATH:

Gold’s cup and handle reversal pattern and gold’s long-term channel paint a promising picture for gold’s future outlook. Gold price chart analysis confirmed a bullish breakout would occur in 2024, already back in 2023, it happened on March 4th, 2024, a date for history books.

The cup and handle breakout occurred on March 4th, 2024. This resulted in a quick rally.

Gold is taking a pause now, nothing wrong and also healthy price action after 5 consecutive green quarterly candles.

Our point is consistent with this post:

$GOLD broke out in Q4 2023.
Means the secular bull market resumed, plus that the 3rd and final bull phase started.
The margin expansion among many miners will be astronomical.
A lifetime opportunity, and threat. Do get prepared. #joinus pic.twitter.com/3JGjGTVp6F

— Graddhy – Commodities TA+Cycles October 15, 2024

Long term gold bull market – invalidation

Now, how do we know for sure that gold is in a long term bull market?

If it does not invalidate!

When would gold invalidate its long term bull market?

If the bullish pattern on the 50-year chart, shown and discussed above, ceases to be the dominant pattern, handing over dominance to a bearish pattern. Which bearish pattern? The rising wedge, by definition bearish.

A potential bearish wedge is visible on the long term gold chart. Now, a few notes about this pattern:

  • So far, it has not shown any form of dominance.
  • It will be dominant once there are similarities with the big declines that marked a major top, back in 1980 and 2011. As seen on the chart, a big intra-quarter drop from the rising trendline should be the ultimate sign that a bearish trend is becoming dominant.

Let’s face it – if gold would turn bearish, it had plenty of opportunity to do so in December 2024. With a wild swing in the USD as well as Yields, gold could have crashed, leaving a wick on the quarterly chart, similar to the ones in 1980 and 2011. It didn’t happen.

We believe the bullish cup and handle pattern is so much stronger than the potential rising wedge pattern.

We will know for sure that gold is bullish if it trades above $2,700 an Ounce on March 31st and June 30th, 2025. This will be ultimate bullish validation on the price/time axes of gold’s long term chart.

10-YEAR ANNIVERSARY OFFER: InvestingHaven.com celebrates 10 years. Temporarily, you can enjoy a discount on our premium gold/silver and crypto reports. Or you can become a VIP member. Go to our anniversary deals >>
Receive our weekly newsletter.

premium service SP-500 premium service trade alerts premium service crypto teaser 

No related posts.

Tags: GOLD
Taki T.

Taki T.

Taki is a chart analyst who is passionate about unlocking unique insights out the chart. While the vast majority of analysts remain focused on price analysis, Taki starts with timeline analysis and adds price analysis to this. In doing so, he developed a unique methodology to find opportunities in financial markets, across assets and markets.

Connect with InvestingHaven

Receive top notch forecasts for free.

*We hate spam as you do.

Site Navigation

  • RSS Feed
  • About us
  • Advertising
  • Sponsored Content Policy
  • Mission 2026
  • Sitemap
  • Privacy & Disclaimer
  • Terms of Service
  • Contact Us
investing haven logo

Precious metals market analysis including gold and silver price predictions. Crypto market analysis including highly accurate BTC ETH SOL XRP forecasts.

Copyright © 2025 InvestingHaven

Login to your account below

Forgotten Password?

Fill the forms bellow to register

All fields are required. Log In

Retrieve your password

Please enter your username or email address to reset your password.

Log In
No Result
View All Result
  • News
  • 2025 Forecasts
    • 10 market predictions
    • Dow Jones forecast 2025
    • S&P 500 forecast 2025
    • Nasdaq prediction 2025
    • Best crypto to buy now
    • Which crypto will explode
    • Best altcoins to buy
    • 15 crypto forecasts 2025
    • Which precious metal to buy
  • Silver articles
    • Silver prediction 2025 – 2030
    • Will silver exceed $30?
    • When will silver hit $50?
    • Can silver hit $100?
    • Silver shortage
    • 50-year silver chart
    • Silver bullish reversal
    • Silver seasonality charts
    • How to invest in silver
  • Gold
    • Gold prediction 2025 – 2030
    • Will gold set new ATH?
    • Will gold hit $3,000?
    • Can gold hit $10,000?
    • Gold chart 10 years
    • Gold chart 50 years
    • Gold chart 100 years
    • Gold silver ratio
    • Gold seasonality charts
  • Commodities
    • Sugar forecasts
    • Coffee forecasts
    • Nickel forecasts
    • Lithium investing
  • Crypto news
  • Crypto forecasts
    • BTC prediction 2025 – 2030
    • ETH prediction 2025 – 2030
    • SOL prediction 2025 – 2030
    • XRP prediction 2025 – 2030
    • XLM prediction 2025 – 2030
    • BNB prediction 2025 – 2030
    • ADA prediction 2025 – 2030
    • AVAX prediction 2025 – 2030
    • KAS prediction 2025 – 2030
    • NEAR prediction 2025 – 2030
    • BCH prediction 2025 – 2030
    • LINK prediction 2025 – 2030
    • DOT prediction 2025 – 2030
    • SUI prediction 2025 – 2030
    • ICP prediction 2025 – 2030
    • LTC prediction 2025 – 2026
    • STX prediction 2025 – 2030
    • DOGE prediction 2025 – 2030
    • SHIB prediction 2025 – 2030
    • PEPE prediction 2025 – 2030
    • FLOKI prediction 2025 – 2030
    • WIF prediction 2025 – 2030
    • ONDO prediction 2025 – 2030
  • Premium Crypto Alerts
  • Premium services

Copyright © 2025 InvestingHaven