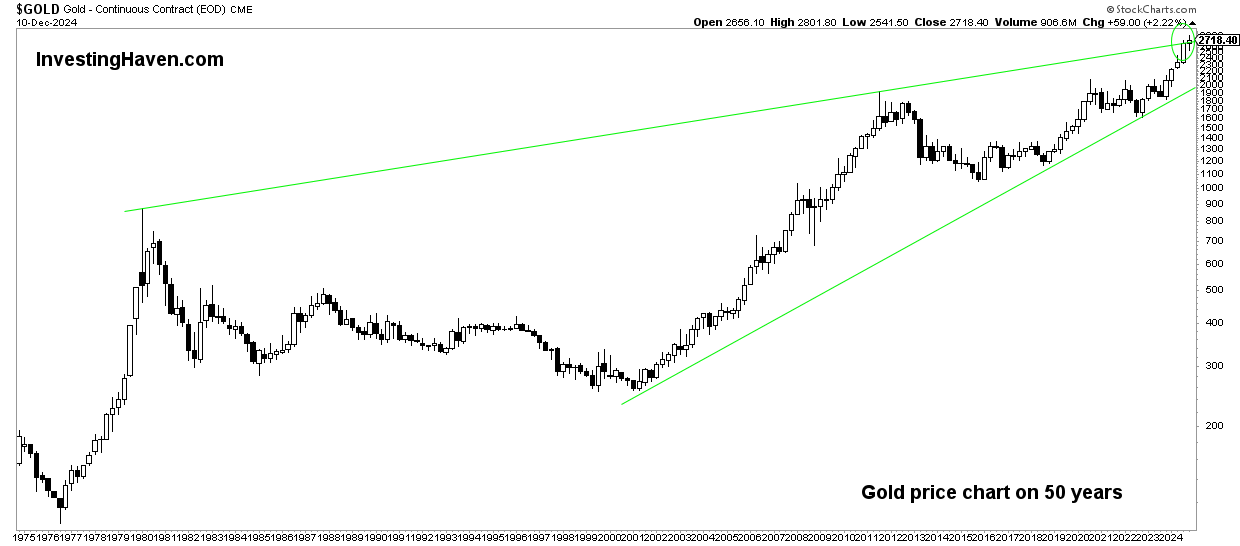
More specifically, if gold succeeds in trading near $2700 on Dec 31st, 2024, as well as March 31st, 2025, it will likely invalidate a long term bearish outcome.
RELATED – Gold prediction 2025 through 2030.
While gold bulls prefer not to talk about a bearish outcome, it is imperative to always consider both sides of the trade (bullish and bearish).
We remain confident about the long term gold bull market but we must assess the bearish scenario irrespective of how bullish we may be.
Gold – the importance of $2700
The importance of $2700 for the gold price is originally explained in our piece Gold Chart over 50 Years.
In particular the rising wedge is the one pattern that gold bulls (including ourselves) prefer to see invalidated. These are the conditions in which the potential rising wedge setup will be concerning:
Gold’s current or next quarterly candlestick leaves a large wick similar to the ones in 1980 and 2011. This would come with a big drop before Dec 31st, 2024, or March 31st, 2025. We are not predicted this, we are only defining the conditions to understand bullish vs. bearish outcome.
We added one important additional thought:
If there is one very strong and compelling reason why gold may will move higher it would be the fact that gold’s breakout in April of 2024 resulted in just a 30% rise. Compare this to 1980 and 2011 when gold went up triple digits before hitting a strong turning point.
This rising wedge should invalidate, for the gold bull market to continue. This invalidation will only come in case gold clears $2,700 in the coming quarters.

Gold at $2700 – from resistance to support
After a nearly 8-month rally, the price of gold went from its former ATH at $2,000 to slightly above $2,700.
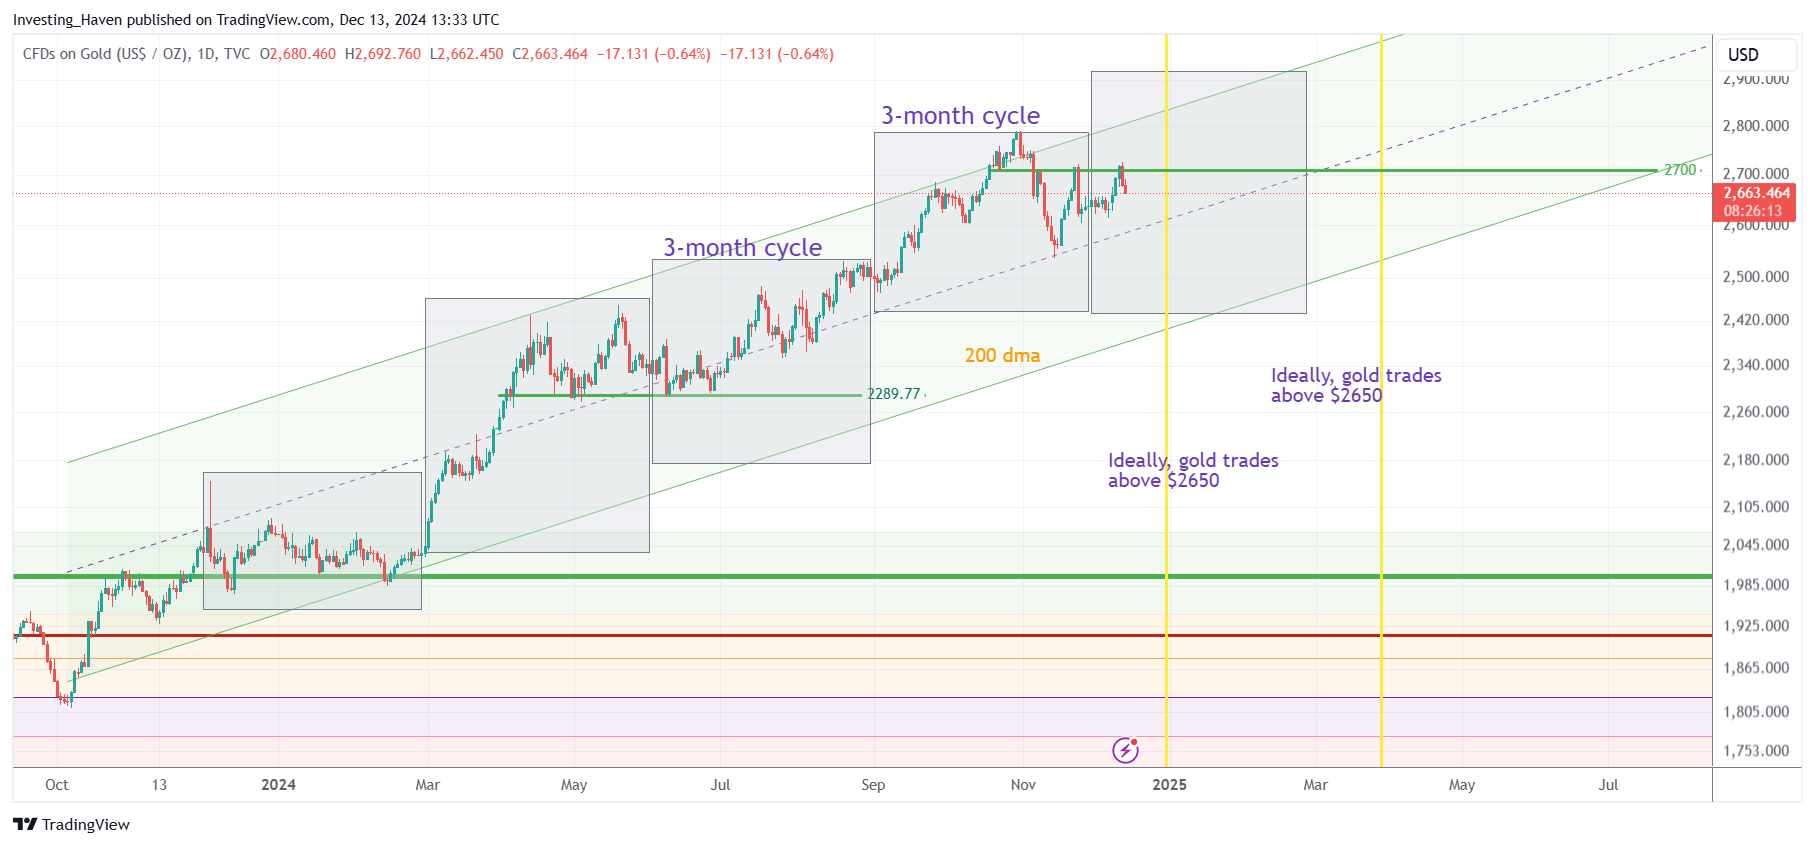
In the first week of November, gold found significant resistance at $2,700.
The gold chart below, a short term oriented chart compared to the one above, visualizes how gold found resistance at $2,700. As seen, when gold hit $2,700 in November of 2024, it was at the top of the rising channel.
Note – $2,700 will become support of the rising channel in July of 2025.
What this really means is that the rising channel should be respected in the coming 6 months. As long as gold trades within this channel, by next summer, it will invalidate the potential bearish wedge shown on the long term gold chart above.

Gold – long term and short term
As said many times in the past, it is the combination of long and short term oriented charts that need to be considered to get a thorough understanding view on a market.
In the case of gold, we conclude the following:
- Gold confirmed a long term bull market after it cleared former ATH in March 2024.
- Gold’s rally to $2,700 was solid, and the chart pattern that it created gives confidence in the long term bull market.
- On the flipside, if gold would set a top at $2,700 given the potential rising wedge on its chart it would offset the bullish setups currently visible on the chart.
- The long term gold chart requires gold prices near $2,700 (say in the $2,550 to $2,700 area) on Dec 31st and March 31st.
- The short term gold chart suggests trading with the rising channel, with gold remaining above $2,700 by July 2025.
This is the gold bull market checklist. The conditions are clear (unlike gold news, typically not clear). Readers can track how gold evolves on specific points in time to get a clear understanding of the bullish potential in the gold market.


