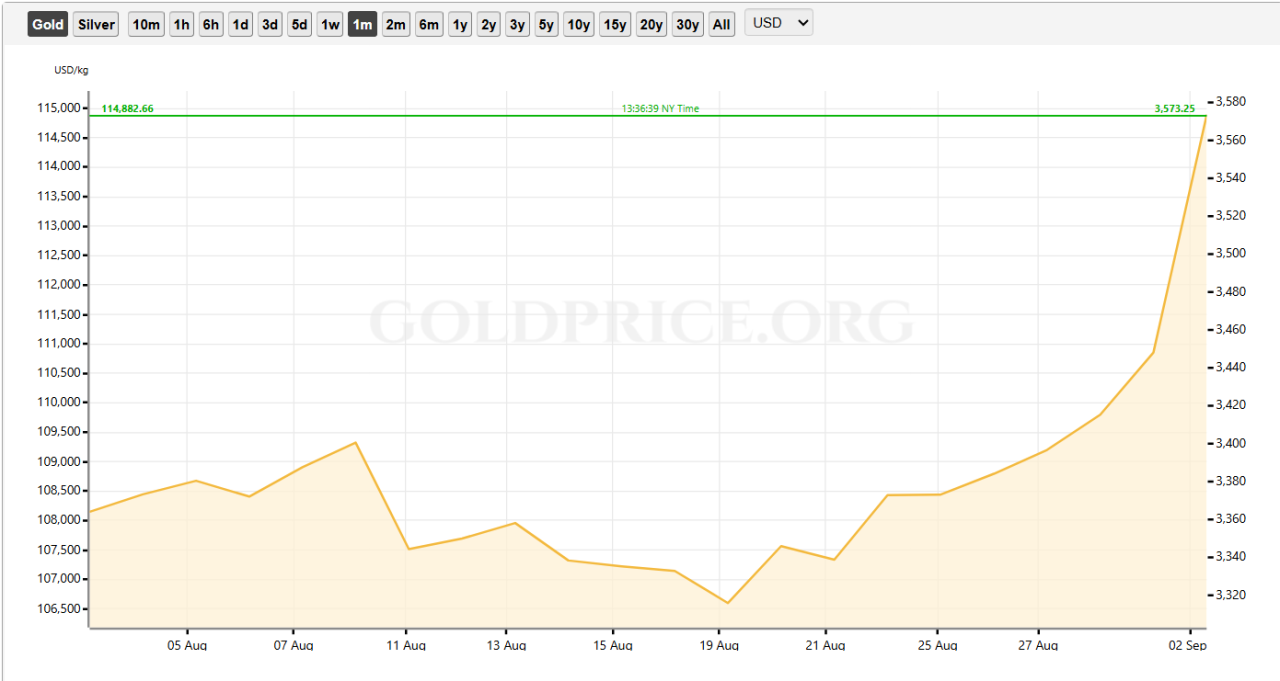
Gold topped $3,500 this week, signaling strong investor demand. Traders should watch yields, Fed cues, ETF flows and momentum.
Gold pushed above $3,500 per ounce this week, reaching all-time highs and rising roughly 34.5% year-to-date.
Heavy inflows to physically backed ETFs and sustained official purchases have tightened available metal, and market pricing for an expected Fed rate cut has lowered real yields, increasing demand for non-yielding bullion.
RELATED: Gold Price Rally: Safe-Haven Strength or Overheating Risk?
Drivers: Why Gold Price Broke Out
Central bank purchases and ETF demand account for the bulk of the accumulation. The World Gold Council shows global physically backed ETFs recorded US$38bn of inflows in H1, and total Q2 demand reached 1,249 tonnes, with demand value at US$132bn.
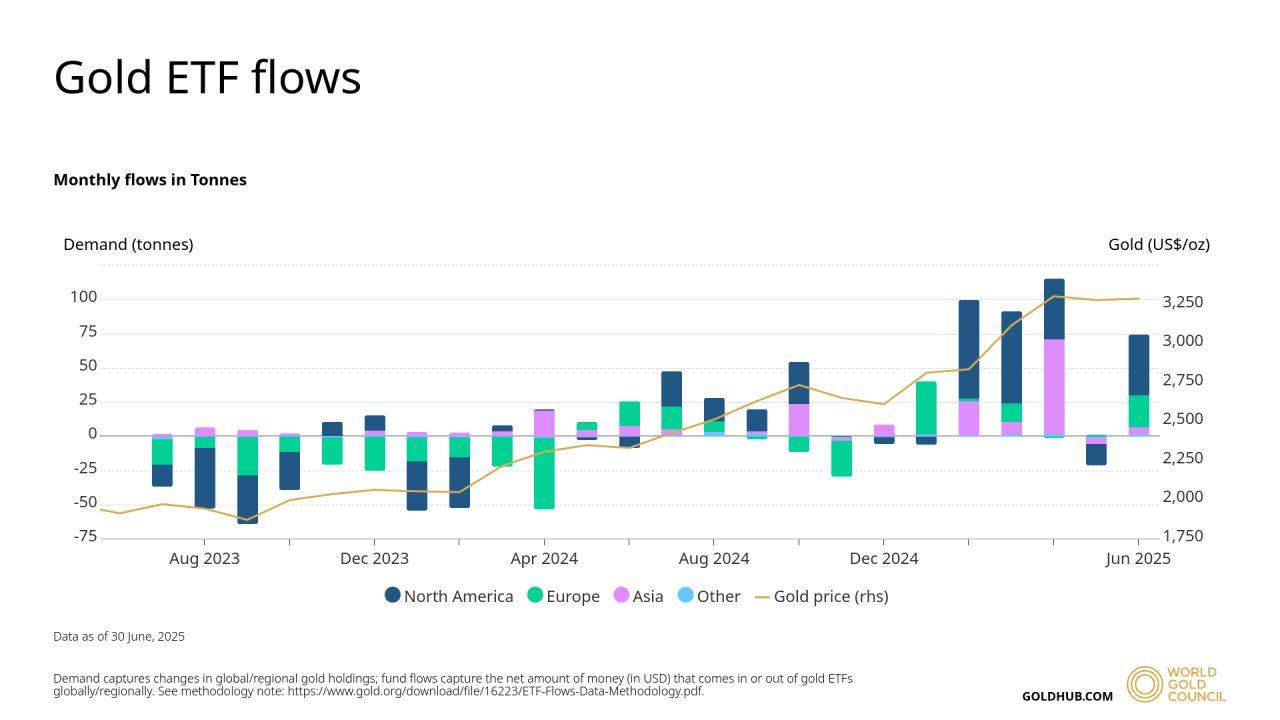
Official buyers remain near record levels, extending the multi-year pattern of reserve diversification. Markets currently assign roughly a 70% probability to a September Fed rate cut, which reduces the opportunity cost of holding gold.
A softer dollar and elevated market volatility have encouraged allocations to bullion by institutional buyers and reserve managers.
RECOMMENDED: UBS Sees Macro Forces Driving Gold Prices To $3,700 By Mid 2026
Levels, Gold Price Forecasts and Catalysts to Watch
Technically, $3,500 now acts as key support, while resistance clusters sit around $3,600 to $3,700 where prior selling appeared. JP Morgan models point to an average of $3,675/oz by Q4 2025 and potential prices above $4,000/oz by Q2 2026.
InvestingHaven’s Gold price forecasts correctly predicted that the metal would hit $3,500 in 2025. Our analysts also predict we could see gold touch $3,900 in 2026 and as high as $5, 155 by 2030.
In fact, a sustained break above $3,700 would clear a path toward $3,900 and $4,000, while a rise in real yields or a stronger dollar would likely force a pullback toward the $3,200–$3,400 zone.
Traders should track option-implied volatility, futures open interest, daily Gold ETF flows and official purchases, and watch Fed policy at the September 16–17 meeting and upcoming US CPI and payroll prints for confirmation.
RECOMMENDED: 5 Reasons to Buy Gold in 2025
Conclusion
The new gold all-time high reflects concentrated investment demand and shifting policy expectations, which leave room for further gains. That outcome is conditional, and traders should treat $3,500 as a key stop or scaling level, assume event risk from the Fed, CPI and payrolls, and monitor ETF and official flows for confirmation. Otherwise, keep position sizes small during event windows and apply clear risk limits.
Stay Ahead of the Market – Get Premium Alerts Instantly
Join the original market-timing research service — delivering premium insights since 2017. Our alerts are powered by a proprietary 15‑indicator system refined over 15+ years of hands-on market experience. This is the same service that accurately guided investors through stock market corrections and precious metals rallies.
Act now and discover why thousands rely on us for timely, actionable signals — before the market makes its move.
Here’s how we’re guiding our premium members (log in required):
- Must-See Monthly Gold & Silver Charts (Aug 31)
- The 5 Most Important Silver Charts For H2/2025 (Hint: Very Bullish) (Aug 23)
- Silver – Speculators Keep Exiting The Long Side. What Does It Mean?(Aug 16)
- Must-See Secular Charts: Precious Metals Mining Breakout & More (Aug 9)
- The Monthly Silver Chart Looks Good + A Special Harmonic Setup On The EURUSD (Aug 2)
- A Trendless Summer for Precious Metals? (July 26)


