
After a spirited rally that sent gold prices to a new all-time high, gold has retreated and shed close to $200. Is it losing momentum or is this a normal pullback before the next leg up?
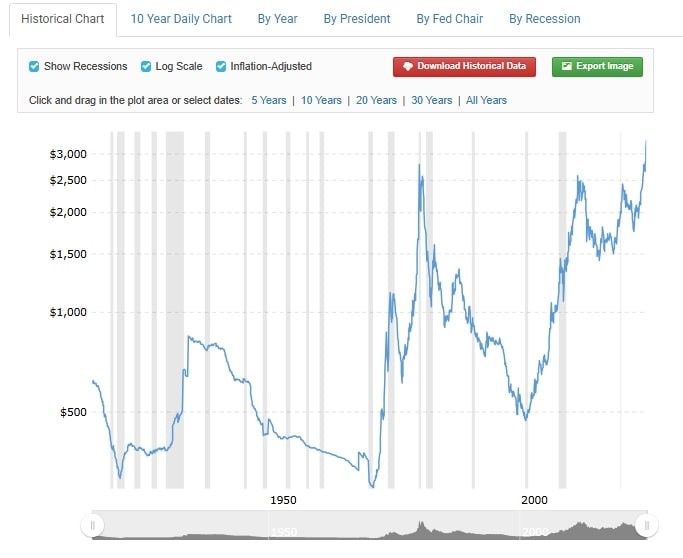
Gold had the most successful first quarter in decades when it rallied by 34% to set a new record above $3,500. Less than a week after hitting this milestone, gold has skidded by at least 6% to trade around $3320 at press time.
Despite the raging debate about possible lost momentum, we are convinced this is a normal cool off phase after such a spirited and extended rally.
And that the yellow metal will be setting sights on a new all-time high during the next phase of its uptrend – possibly peaking around $3600 in the second quarter.
Our conviction is based on both the technical analysis of the gold price chart as well as a deeper understanding of the macro factors influencing gold prices. The two are still bullish about the asset’s future price action.
Technical Analysis of Gold
Gold’s current price action suggests that it has entered a consolidation phase. And with the small pullback, key support levels have been identified around $3,145 and $2,955 and a psychological support of $2,790. These correspond with recent highs and Fibonacci retracement levels.
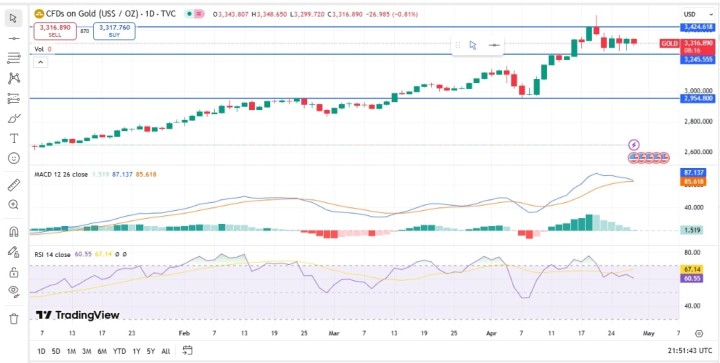
Our analysis has also noted a key resistance around $3,400 but suggests a bull run may resume, and possibly help gold retest the $3,500 high if investor interest surges.
The technical indicators offer mixed signals implying that gold prices can swing in either direction. The RSI, for example, has declined from the overbought highs of # recorded earlier in the year to 61. The Stochastic Indicator, on the other hand, is still mildly bullish at 63.
Fundamentals Supporting Further Gold Uptrend
We have observed that despite the recent dip, long-term structural factors continue to support an upward trend for gold prices.
For starters, the central banks of emerging market, especially India, Russia, and China, continue to diversify their reserves and de-dollarize.
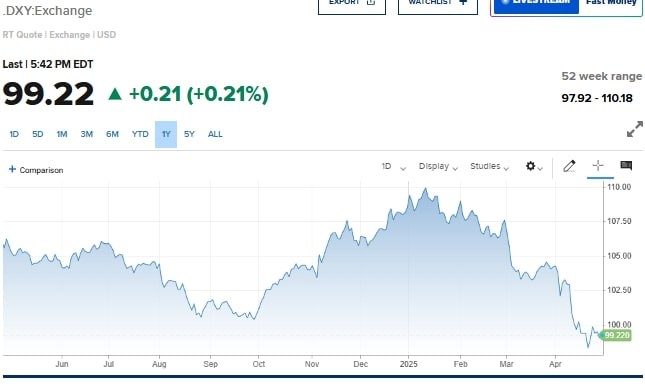
This, among other factors, has caused a sharp value decline for the US Dollar over the last few months.
Additionally, investor sentiment remains cautious amid global economic uncertainties. This comes amidst pessimistic reports about US economic growth and recession fears.
Recently, the world bank lowered economic growth forecast for the US to less than 2% for the year. The likes of JP Morgan and Goldman Sachs have also adjusted the odds of the US and global economy sinking to recession in 2025 to as much as 60%.
In light of all these, analysts from JP Morgan and Goldman Sachs forecast gold prices reaching between $3,700 and $4,500 by year-end or early 2026.
These confirm our observation that gold price hasn’t lost momentum, rather it is consolidation in readiness for the next phase of the price rally.
Key Price Levels to Watch for Gold
$3,400 resistance level remains the most critical price mark to watch. A sustained move toward and above this level could signal a resumption of the bullish trend, which will almost definitely lead to new highs.
Conversely, the failure to break this level will likely result in further consolidation or an even deeper correction.
Should You Buy Gold
Yes, because even with consolidation or deeper price drop, gold will always rebounded. And while it may not be the most lucrative asset to hold especially when compared to the likes of Bitcoin, it is less volatile.
Best Gold Trading Platform for Intermediate Traders and Investors

Invest in gold and 3,000+ other assets including stocks and cryptocurrenncy.
0% commission on stocks - buy in bulk or just a fraction from as little as $10. Other fees apply. For more information, visit etoro.com/trading/fees.
Copy top-performing traders in real time, automatically.
eToro USA is registered with FINRA for securities trading.
30+ million
Users worldwide
Check out our most recent alerts – instantly accessible
See them all by clicking here
- The Precious Metals Charts That Bring Clarity Through Noise (April 27th)
- Highly Unusual Readings In Gold & Silver Markets (April 20th)
- Gold Miners Breaking Out, Here Are A Few Gold Stock Tips. What About Silver & Miners? (April 13)
- Gold, Silver, Miners – Bottoming or More Downside? (April 5th)
- Why Next Week Matters for Gold — But Less So for Silver (March 29th)
- Is the USD About to Bounce? What Are the Implications? (March 22nd)
- Silver Hit Its Acceleration Point. 5 Critical Dates Every Silver Investor Should Watch. (March 15th)


