KEY TAKEAWAYS
- Gold is trading around $4,000, closely tracking movements in U.S. real yields, which remain the strongest short-term price driver.
- A rise in real yields makes gold less attractive, while a drop in yields often sparks new buying interest.
- The 10-year real yield and inflation breakeven rates explain most of gold’s recent sideways action.
- The next major move will likely depend on U.S. inflation and Treasury data rather than broader market sentiment.
Gold’s performance now depends heavily on U.S. real yields and inflation expectations. Even small changes in these measures have recently shifted prices.
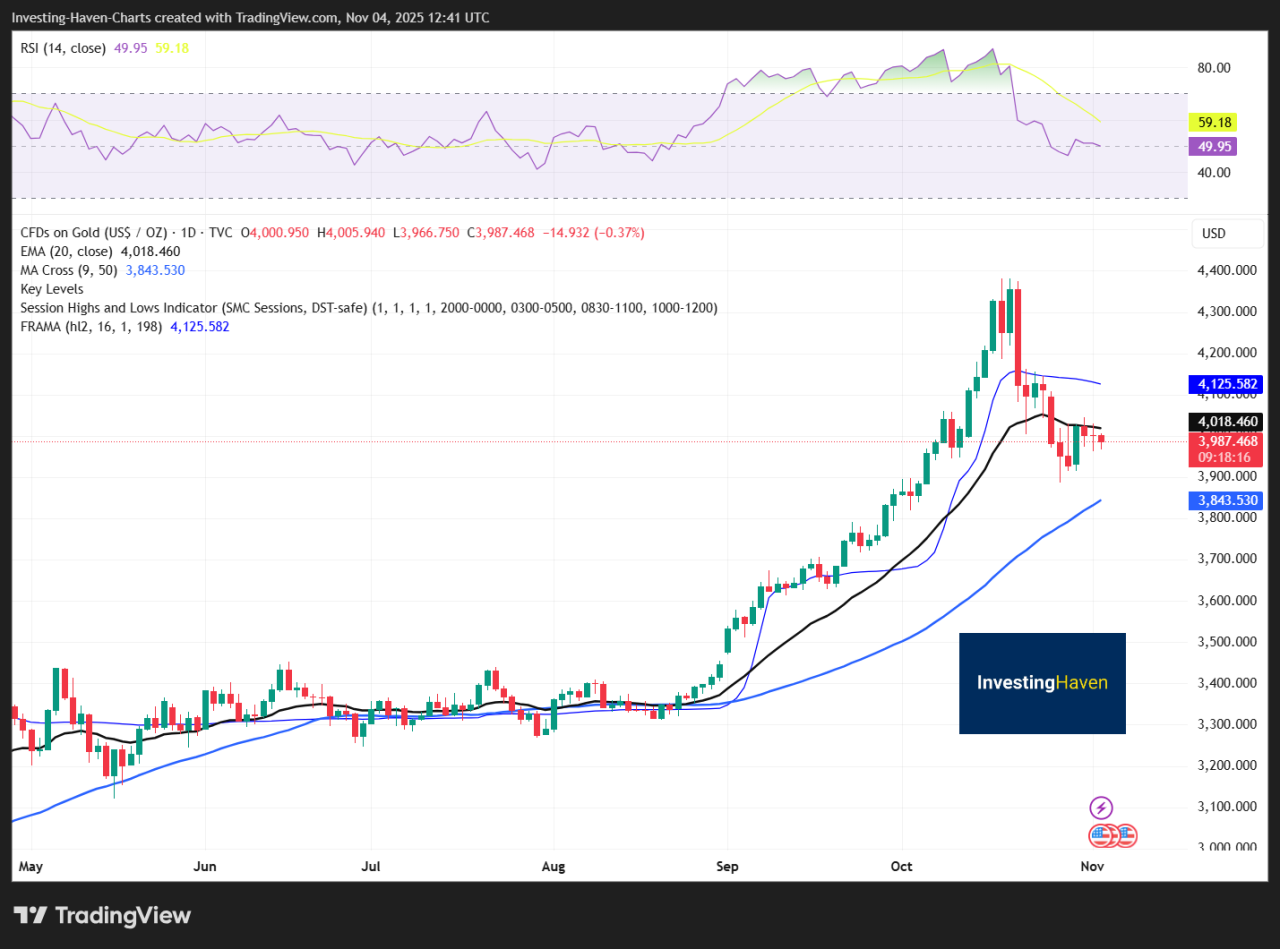
Gold is holding around $4,000 an ounce after a strong run this year. Its next move may depend on what happens to real U.S. Treasury yields, which adjust for inflation. When real yields rise, investors prefer interest-bearing assets over gold.
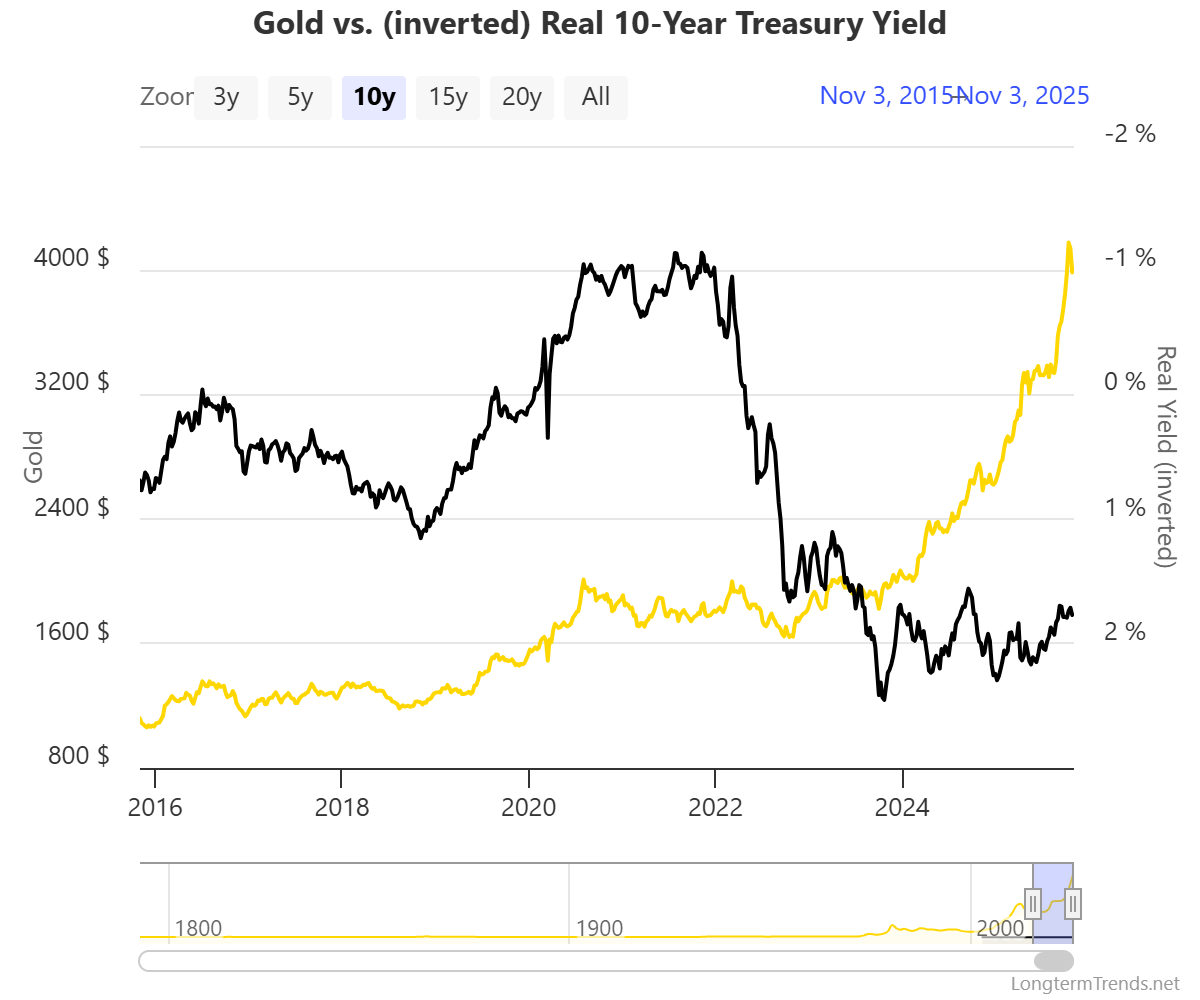
When they fall, gold becomes more appealing as a store of value. Over the past month, gold has shown a strong negative correlation of about -0.8 with real yields, meaning prices often move in opposite directions.
ALSO READ: Can the Gold Rally Extend or Is a Retrace Coming?
Gold And Real Yield Trends
In recent sessions, spot gold has traded between $3,990 and $4,015 per ounce, pausing after its latest rally.
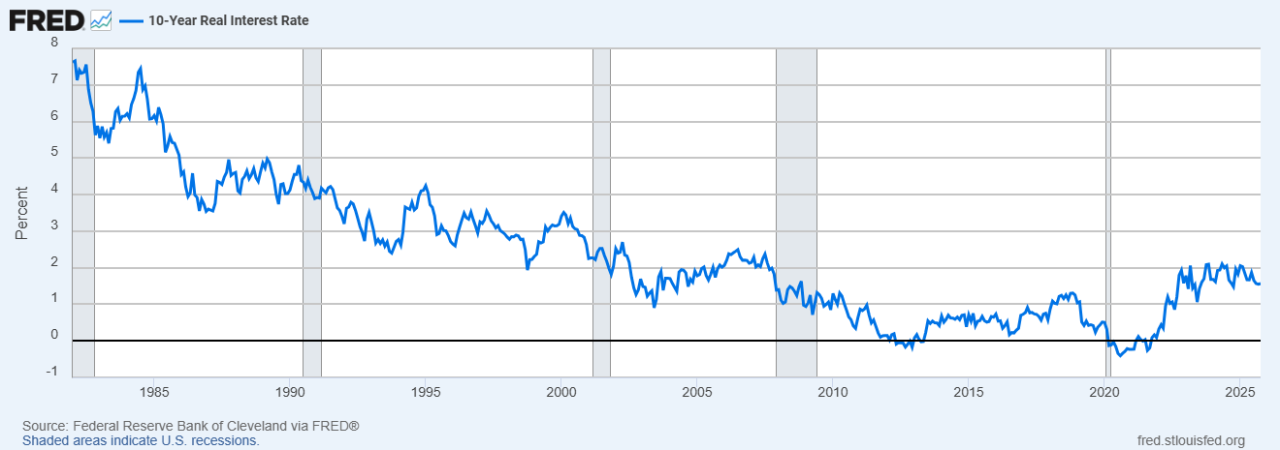
The 10-year real yield has fluctuated but stayed positive, suggesting investors still expect the Federal Reserve to keep rates elevated for longer.
Inflation expectations, measured through breakeven rates, remain steady. These figures explain most of gold’s recent sideways movement. Market watchers often track 10-day and 30-day averages of real yields to filter out short-term noise and spot momentum shifts.
RECOMMENDED: Why Do USD Moves Now Drive Both Gold And Crypto?
Real Yields vs Gold: How Real Yields Shape Gold Prices
Real yields represent the return investors get on U.S. Treasuries after accounting for inflation. When those returns rise, gold loses some appeal because it does not pay interest. When real yields drop, gold tends to attract more buyers looking for stability.
Historically, a 0.5-point decline in real yields has often lifted gold by several percentage points. The pattern has repeated in 2025: gold’s sharp rallies came when real yields fell, and its pauses occurred when they climbed back up.
YOU MIGHT LIKE: How Renewed Central-Bank Gold Purchases Are Re-Shaping Prices
Key Levels And Market Outlook
If real yields edge lower or the Fed signals rate cuts, gold could push past $4,200 and test $4,300. But if U.S. data strengthen and yields rise again, gold might retreat toward the $3,800–$3,900 support area.
The balance between inflation expectations and Treasury yields will likely set the tone in the coming weeks.
RECOMMENDED: Platinum, Gold, Palladium & Silver Dominate YTD Performance
Conclusion
Gold’s path from here depends less on market excitement and more on real yield direction. Keep an eye on U.S. inflation data, Treasury yields, and the $4,000 level, they will tell the story before the price does.
Stay Ahead of the Market – Get Premium Alerts Instantly
Join the original market-timing research service — delivering premium insights since 2017. Our alerts are powered by a proprietary 15‑indicator system refined over 15+ years of hands-on market experience. This is the same service that accurately guided investors through stock market corrections and precious metals rallies.
Act now and discover why thousands rely on us for timely, actionable signals — before the market makes its move.
Here’s how we’re guiding our premium members (log in required):
- Gold Overheated. Silver Breakout Back Test. What’s Next? (Oct 18th)
- In Focus: Gold’s Hot Sentiment and Silver’s Intraday Reversal. (Oct 11th)
- Is Silver Ready To Crush Its 45-Year Resistance? (Oct 4th)
- Will Silver Set a Major Top at $50/oz? Our Deepest Analysis Yet. (Sept 27)
- Silver Rally Fueled by Absent Speculators (Sept 20)


