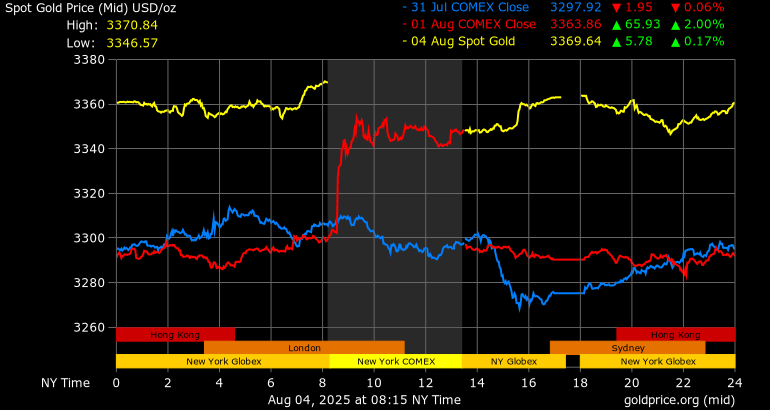
Gold trades near $3,379 on rate‑cut hopes after softer jobs data. It now moves inside a tightening triangle with signs of a breakout or stall.
Spot gold sits at $3,369 per ounce after a roughly 1.8 percent gain last session on the U.S. jobs miss that showed just 73,000 new positions added in July. Traders now price in an 81 percent chance of a Fed rate cut in September.
The metal forms a symmetrical triangle between $3,300 support and $3,360–$3,372 resistance, setting the stage for a potential breakout or squeeze. The outlook now hinges on fresh U.S. data and policy signals.
Tightening Price Patterns: Triangle Near a Decisive Break
Gold has traded inside a narrowing triangle for weeks with lower highs pressed against $3,379 and higher lows near $3,300 support. A daily close above $3,380 could trigger upside momentum targeting $3,430 or more. If the price drops below $3,330, bulls may pull back toward $3,200. The gold triangle consolidation now signals a pivotal choice. Declining volume in recent days points to exhaustion inside the coil.
Macro Forces Boost Upside Targeting $3,500
Citi just lifted its 3‑month gold price forecast to $3,500, expanding its expected trading band to $3,300–$3,600, citing worsening U.S. growth, tariffs, and a weak dollar.
Global gold demand rose 3 percent in Q2 to 1,248.8 tonnes, due to growing ETF inflows and central bank buying. Central bank gold buying now accounts for a third of total demand, reinforcing the structural case.
What to Watch This Week
You should watch U.S. CPI, PCE, and Powell commentary. Clear signals can tip the triangle one way.
A breakout above resistance would reinforce the case for a Fed rate cut and gold rally toward $3,430–$3,500. If the price falters at $3,360, the metal may trade within the $3,300 trading range until fresh catalysts shift sentiment.
Conclusion
Gold now sits at a potential turning point. You must watch whether it breaks gold breakout resistance above $3,372–$3,380. A confirmed move higher opens the path to $3,500. Failure could confine gold to the lower half of the triangle.
Analyzing price, time, leading indicators
InvestingHaven’s premium trading service is intended to help investors who are interested in the gold & silver market.
We analyze multiple charts to understand price trends, bullish & bearish time windows, turning points. Moreover, we cover leading indicators for the gold & silver price. They help us understand current and future price trends.
RELATED: Premium Gold Investing Service
Our Latest Alerts:
- The Monthly Silver Chart Looks Good + A Special Harmonic Setup On The EURUSD (Aug 2)
- A Trendless Summer for Precious Metals? (July 26)
- Spot Silver in EUR Closes at Highest Weekly Level Ever (July 19)
- Silver Breakout Confirmed Now, Check These Stunning Silver Charts (July 12)
- The Two Only Silver Charts That Matter In 2025 (July 6)


