Gold trades at record highs after recent Fed easing signals and strong official buying. Watch real yields, ETF flows and central-bank purchases this week.
Spot gold sits around $3,700 per ounce after fresh record highs this month, as markets priced a faster path to Fed rate cuts.
Deutsche Bank now models an average $4,000/oz in 2026, while official buyers continue large net purchases. Real yields, ETF flows and central-bank activity can push gold price this week higher or trigger profit taking.
RELATED: Gold Eyes $4,000–$5,000: Momentum Fueled by Fed Outlook
Macro Drivers This Week
Watch three macro levers this week that will move bullion. First, the Fed has cut rates and signaled further reductions, which lowers the opportunity cost of holding gold and weighs on the dollar.
Second, central banks remain heavy buyers, with official net purchases running well above the 2011–2021 average and surveys showing 95% expect reserves to rise.
Third, real Treasury yields can reverse quickly, so weekly ETF inflows and Swiss shipments are key short-term gauges.
RECOMMENDED: De-Dollarization Driving Gold Higher, Is The Next Rally Here?
Technical Set-Up And Key Levels
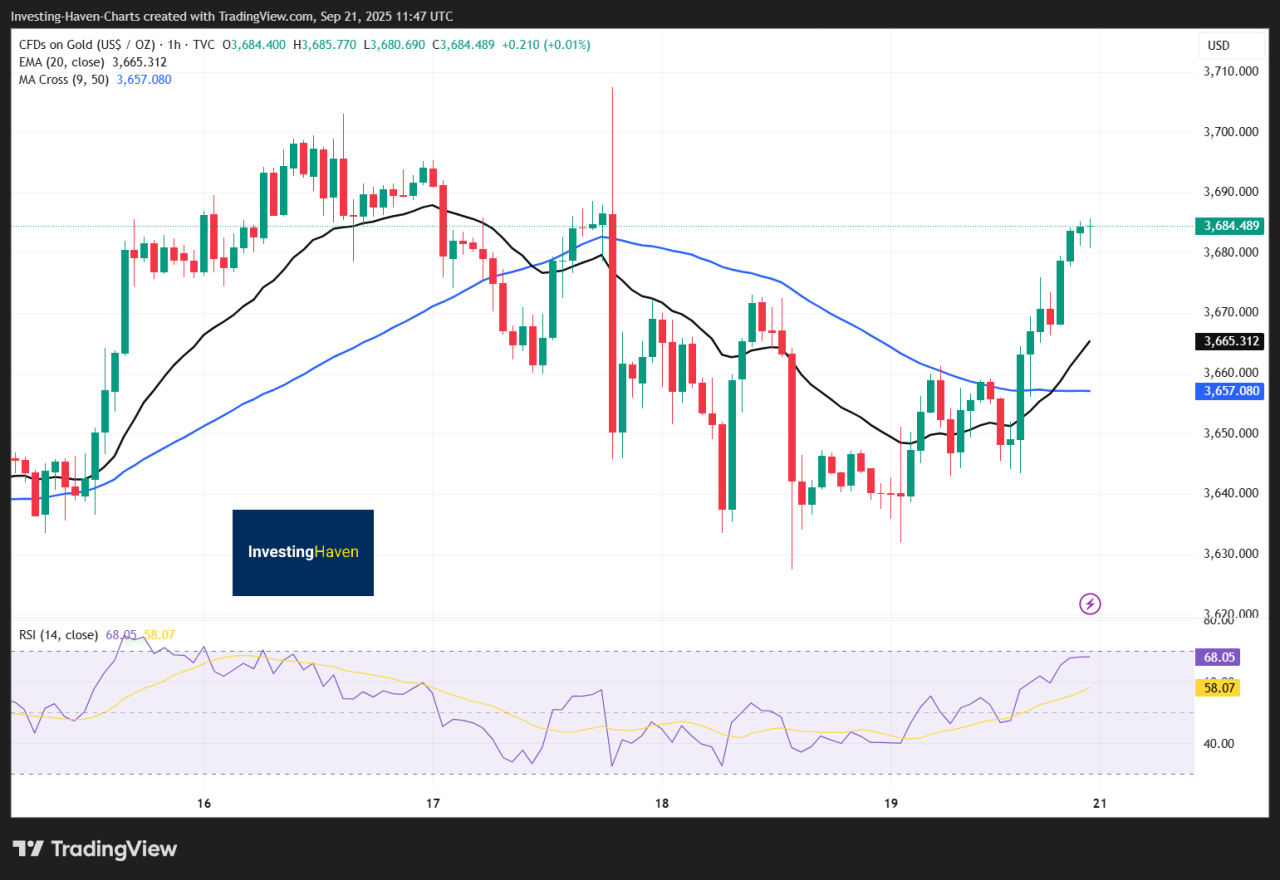
Technically, gold has established support in the $3,600 to $3,700 range, while a sustained move above $3,800 would open the $4,000 conversation that banks now cite.
Deutsche Bank raised its 2026 average to $4,000, reflecting softer yields and ongoing official buying. Traders should watch ETF inflows and futures positioning, and Swiss exports to China as short-term demand signals.
A drop below $3,500 would suggest a corrective phase. For example, GLD added about $1.56 billion this week, a clear sign of retail and institutional demand.
RECOMMENDED: Gold’s Record-Breaking Momentum: Can It Climb Further?
Risk Scenarios And Trade Triggers
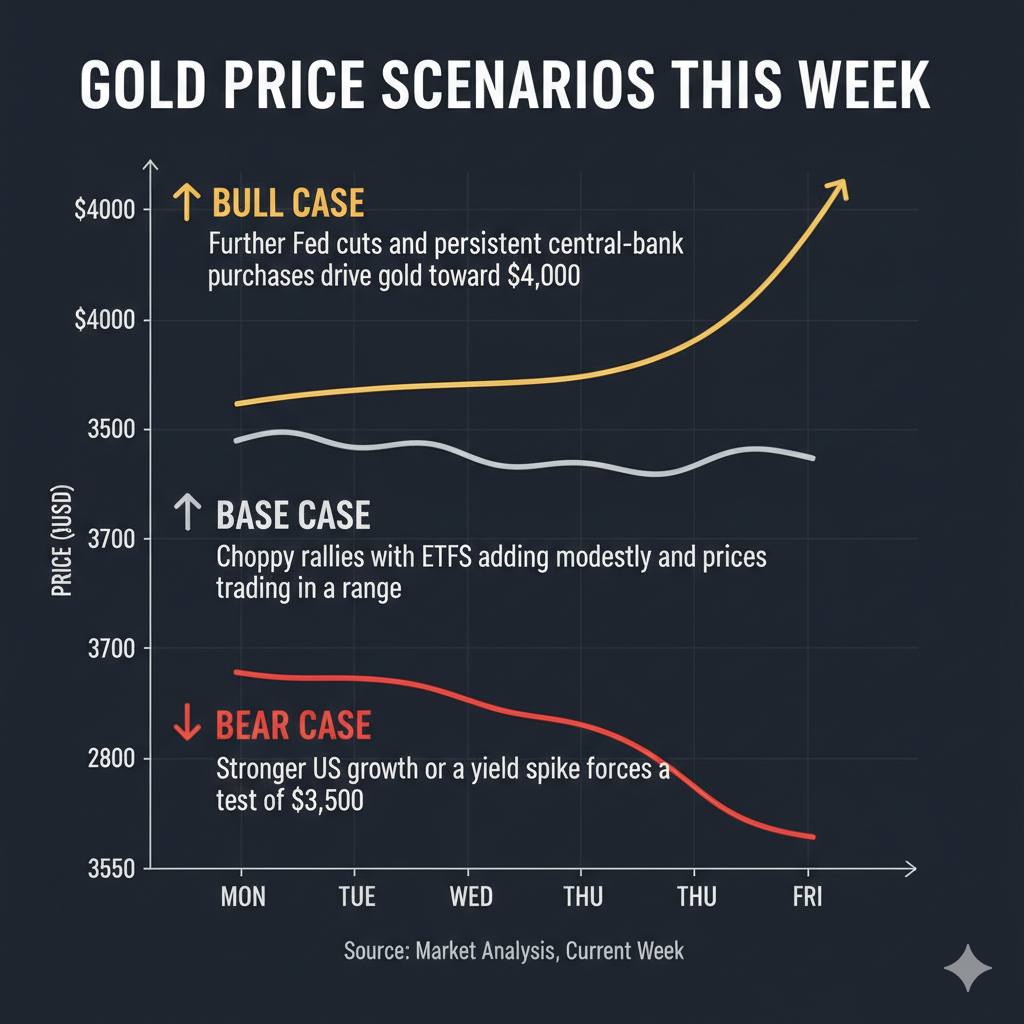
Three scenarios matter this week for gold price prediction:
- Bull case: further Fed cuts and persistent central-bank purchases drive gold toward $4,000.
- Base case: choppy rallies with ETFs adding modestly and prices trading in a range.
- Bear case: stronger US growth or a yield spike forces a test of $3,500.
You can use options flow or size stops to manage directional trades and watch ETF flows for conviction.
RECOMMENDED: 5 Reasons to Buy Gold in 2025
Conclusion
This week the Fed’s path versus steady central-bank buying decides momentum. Track real yields, ETF flows and Swiss shipments for the clearest signal.
When is The Best Time To Buy Gold & Silver?
To receive key alerts and analysis on the best times to buy Gold and Silver, you should consider Joining the original market-timing research service — delivering premium insights since 2017.
InvestingHaven alerts are powered by a proprietary 15‑indicator system refined over 15+ years of hands-on market experience.
This is the same service that accurately guided investors through stock market corrections and precious metals rallies.
Act now and discover why thousands rely on us for timely, actionable signals — before the market makes its move.
Here’s how we’re guiding our premium members (log in required):
- Monster Basing Patterns in Precious Metals Resolving Higher (Sept 6th)
- Must-See Monthly Gold & Silver Charts (Aug 31)
- The 5 Most Important Silver Charts For H2/2025 (Hint: Very Bullish) (Aug 23)
- Silver – Speculators Keep Exiting The Long Side. What Does It Mean?(Aug 16)
- Must-See Secular Charts: Precious Metals Mining Breakout & More (Aug 9)
- The Monthly Silver Chart Looks Good + A Special Harmonic Setup On The EURUSD (Aug 2)


