Gold’s target of $3,000, once a long term price target, now a price target for May through December 2025. As long as gold remains within its rising channel, it can and will hit $3,000 at some point in 2025.
December 13th, 2024 – While gold may not hit $3,000 in 2024, it’s nearly impossible, it is clear that fundamentals are set right for gold to hit $3,000 an Ounce in 2025. Our previous time window for gold to hit $3,000 is February – August 2026, we are adjusting it now to April – May 2025.
Gold has long been revered as a store of value, a safe haven. In recent years, gold’s price has seen fluctuations influenced by a myriad of factors, from geopolitical tensions to shifts in global economic policies.
RELATED – Gold predictions for 2025 to 2030.
However, amidst this volatility, one path seems really clear based on the current chart of price of gold: gold is on its way to hit $3,000 an Ounce. In this post, we try to find out if and when gold will hit $3,000 an Ounce.
We start with our own, proprietary gold chart analysis. We continue with fundamental analysis.
Will gold hit $3,000 an Ounce? The gold chart replies.
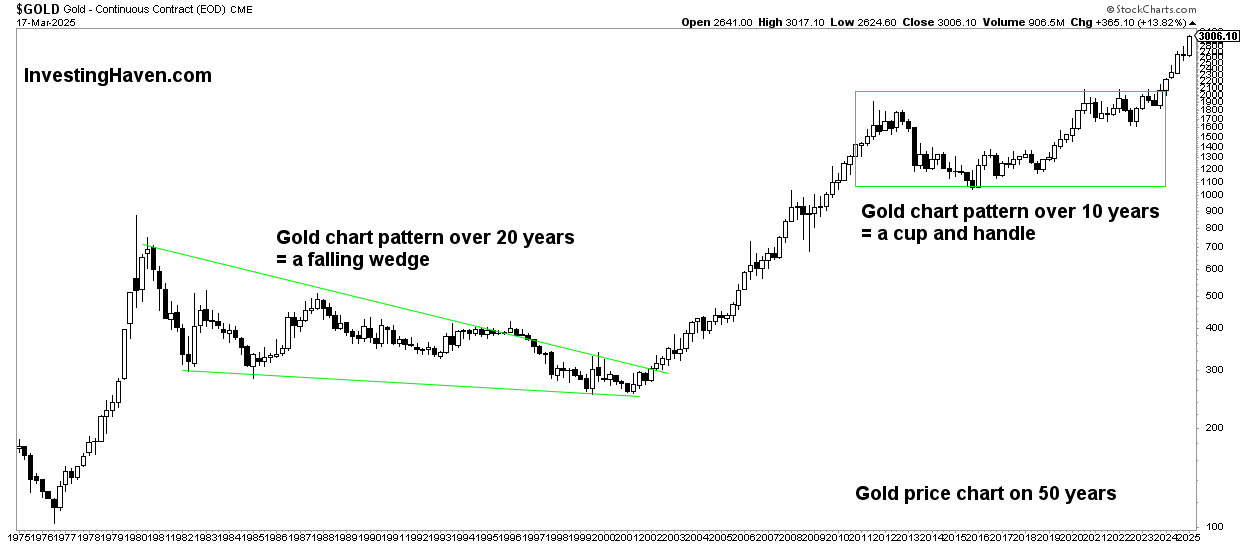
Applying a classic top-down approach, we look at the 50-year gold chart. From our 50-year gold analysis:
2024 onward – there is a new phase visible on the gold price chart of 50 years.
If we carefully analyze the secular phases on the 50-year gold chart, we see that the 10-year consolidation completed in 2024.
This implies that gold entered a new bull market, particularly on March 1st, 2024, when it cleared its former ATH. We agree – 2024 marks the start of gold’s 3d secular bull market.
The key take-away is that gold concluded a 10-year consolidation. This consolidation has the form of a cup and handle structure, a bullish formation.
This is a key insight from this chart is that gold will hit higher price points, and gold can hit $3,000 sooner or later.
December 13th, 2024 – The secular gold price chart is looking increasingly more powerful with each passing month. While gold is not far from hitting $3,000, there is still a way to go. Whether gold requires more rate cuts is questionable, as gold peaked amid rate cuts across the world in Oct/Nov.

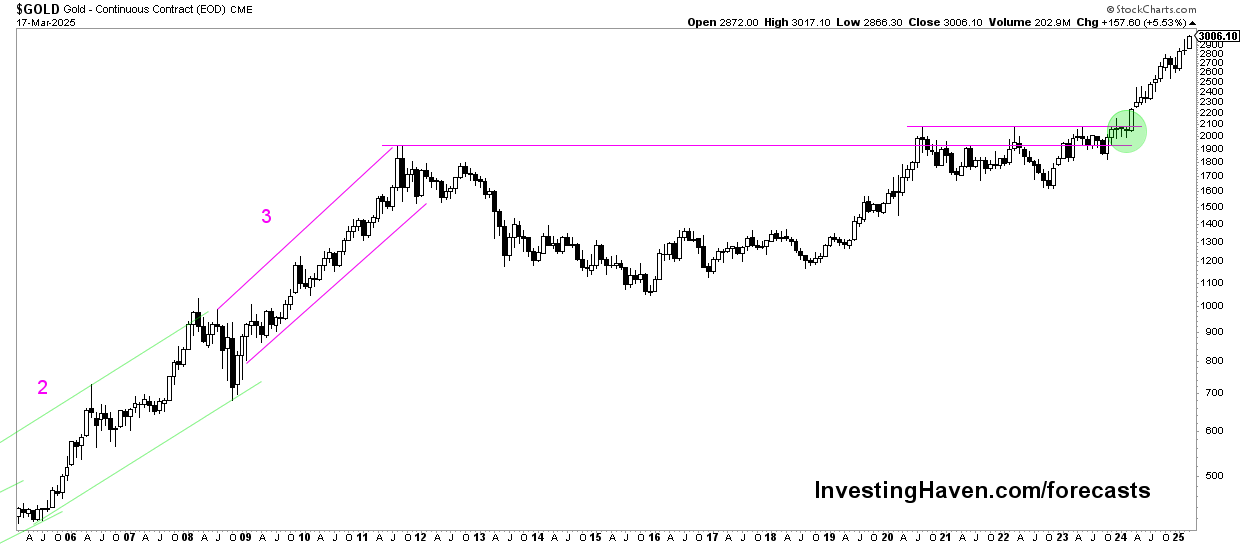
If we zoom into the same chart, and focus on the 20-year gold chart, we can clearly see the breakout taking place.
This breakout, which started on March 1st, 2024, has so much upside potential, simply because of the long (hence strong) bullish pattern that gold created over a time period of 10 years!
December 13th, 2024 – Gold’s 20-year price chart says it all – a powerful breakout after a 10-year basing and bullish reversal pattern was completed in March of 2024. While gold hit big resistance at $2,700, it seems that a consolidation period is upon us. This gold chart, combined with the one below, suggest that gold should not drop below $2,482 for a bullish resolution.

Both gold charts suggest that gold to $3,000 is a reasonable price target.
Note – here is an additional 50-year gold chart on Twitter (X) which is consistent with our conclusions.
When will gold hit $3,000 an Ounce? A likely scenario.
On the question WHEN will gold hit $3,000, we can answer that by looking at the current chart structure.
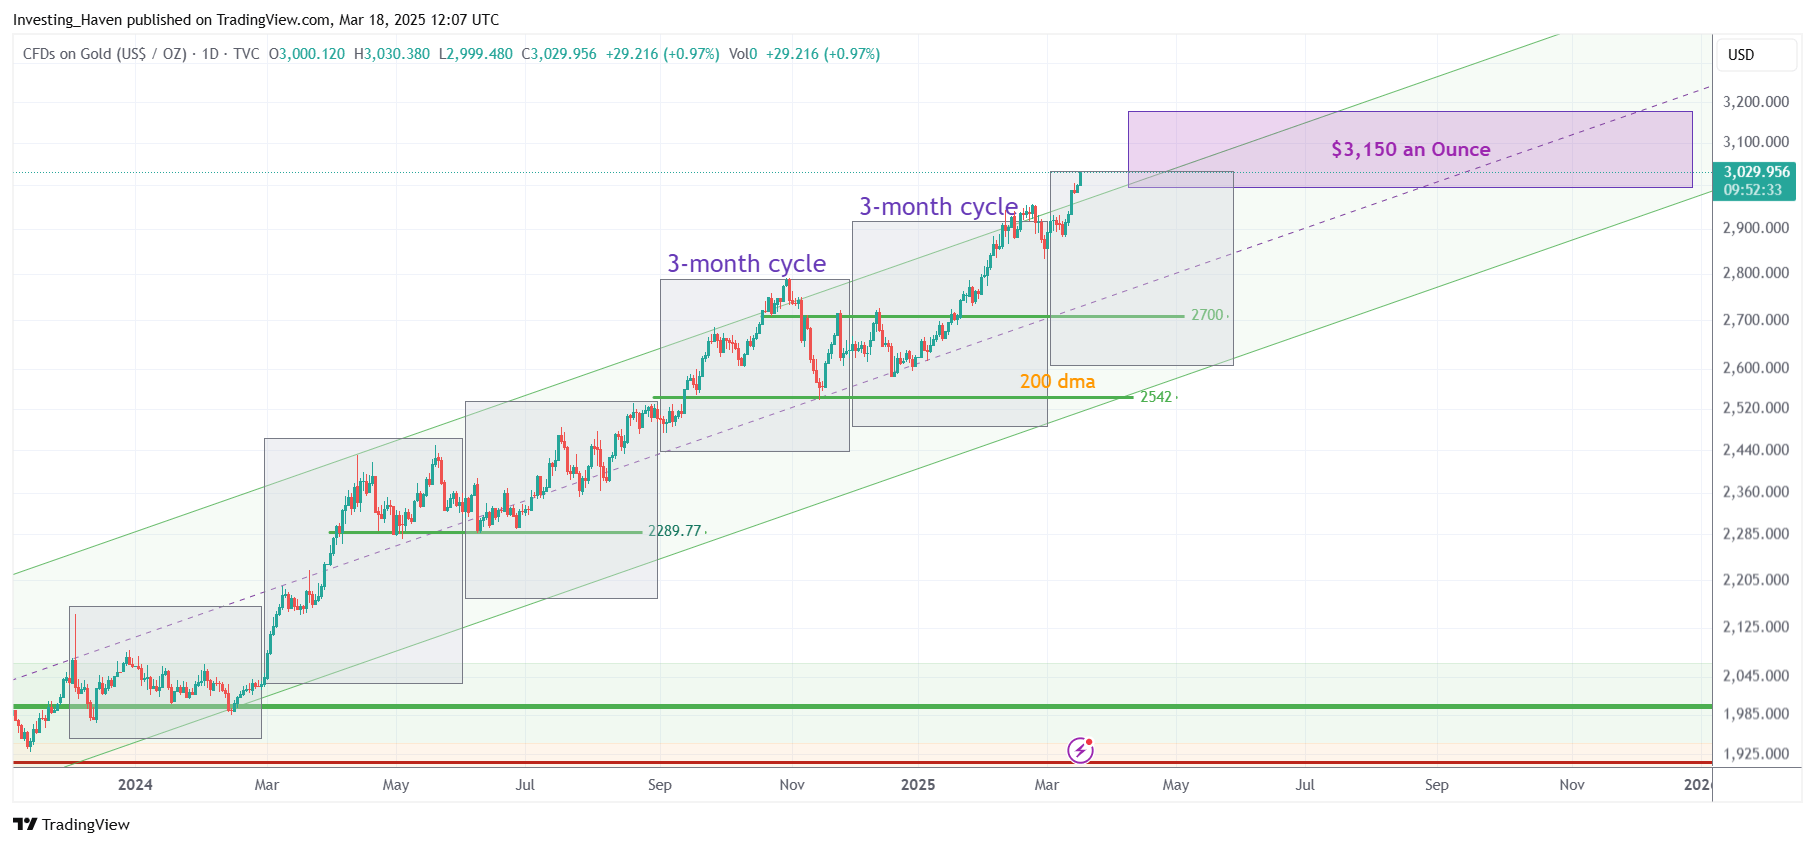
As seen below, the gold price started moving in a rising channel, starting in 2023.
This price channel is pretty perfect.
IF (and that’s a big IF) gold continues to respect this rising channel, it will hit $3,000 in the period May 2025 to December 2025.
December 13th, 2024 – Gold’s potential path to $3,000 an Ounce is still intact. In fact, with the steeply rising channel, it is a feasible path for gold to hit $3,000 mid-2025 or end of 2025. See purple shaded box. An important pre-requisite for gold to hit $3,000 is that it respects its rising channel.

Now, admittedly, this is just one scenario. Other outcomes are possible.
But given the current state of the gold market, with the data at hand, we believe that the projection above has a high level of confidence. This is especially true since we know exactly when this projection invalidates, i.e. when gold falls outside of its rising channel.
Gold to $3,000 an Ounce – the fundamental picture
Gold’s price dynamics are deeply intertwined with various fundamental factors.
- Firstly, let’s consider the supply and demand dynamics. Gold production is relatively stable, with new discoveries offsetting depletion in existing mines.
- However, demand for gold fluctuates based on various factors including jewelry, industrial usage, and investment demand.
- Recently, there’s been a surge in investment demand. Especially central banks have been hoarding large quantities of physical gold.
- Geopolitical tensions also play a significant role in gold’s price movements. Any escalation of conflicts or geopolitical uncertainties tends to drive investors towards safe-haven assets like gold.
- Additionally, central bank policies, particularly regarding interest rates and quantitative easing measures, heavily influence investor sentiment towards gold. With many central banks adopting accommodative monetary policies, concerns about currency debasement are bolstering gold’s appeal.
Many of the above mentioned gold price influencers have been supportive for gold since 2023.
The new gold playbook
In recent times, the gold market has witnessed significant shifts, marked by structural changes in the financial system and geopolitical landscape. These transformations necessitate a new approach for investors (h/o Ronald Stoeferle).
Shifts in demand: Traditional Western financial investors are no longer the primary drivers of gold demand. Central banks and emerging markets, particularly China, have emerged as dominant players in the market, reshaping its dynamics fundamentally.
Another piece from @RonStoeferle:
“The second thing is that China reopened the gold window in Shanghai with the Shanghai Gold Exchange.”https://t.co/FuKEaSUzpB
— Jaime Carrasco June 8, 2024
Eastward gold flows: Central banks in emerging markets, notably in Asia, have played a crucial role in supporting gold prices. The demand for gold jewelry in the region, led by China, India, and the Middle East, underscores the significant shift in gold consumption patterns.
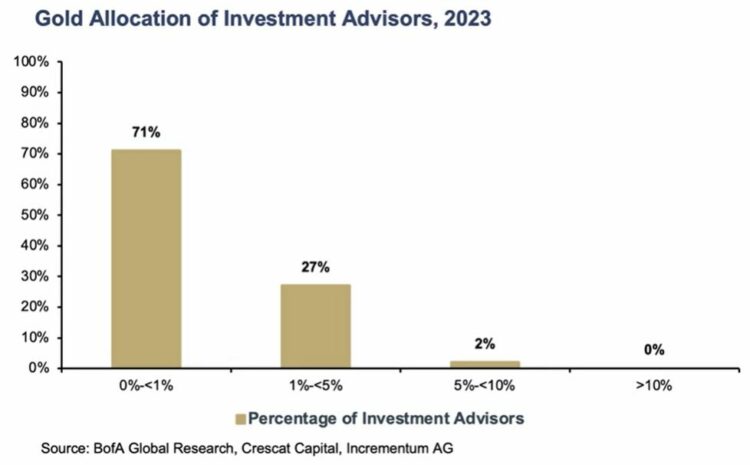
Western investors lagging: Despite these changes, Western financial investors have been slow to adjust their portfolios, with a substantial portion still underexposed to gold. However, rising inflation and the looming possibility of recessions may prompt a shift in sentiment towards gold as a hedge.

Unsustainable debt levels: The global debt burden has reached unprecedented levels, with the US alone accumulating over $11 trillion in debt since January 2020. This alarming trend, coupled with projections of interest payments becoming the largest federal budget category, highlights the urgency for alternative investment strategies.
Gold-backed currencies: Efforts by countries like China, Russia, and their allies to reduce dependence on the US dollar in international trade have led to discussions around the potential for gold-backed currencies. This geopolitical maneuvering could have profound implications for the global financial landscape.
Conclusion
In conclusion, while predicting the exact trajectory of gold prices is inherently uncertain, a combination of fundamental and chart analysis provides valuable insights for investors.
The fundamental factors point towards a supportive environment for gold, with ongoing economic uncertainties and accommodative monetary policies fueling investor demand.
December 13th, 2024 – We stick to our timeline for gold to hit $3,000 to mid-2025 or end of 2025. We add one important condition, i.e. the long term rising trend channel on the gold chart must remain intact.


