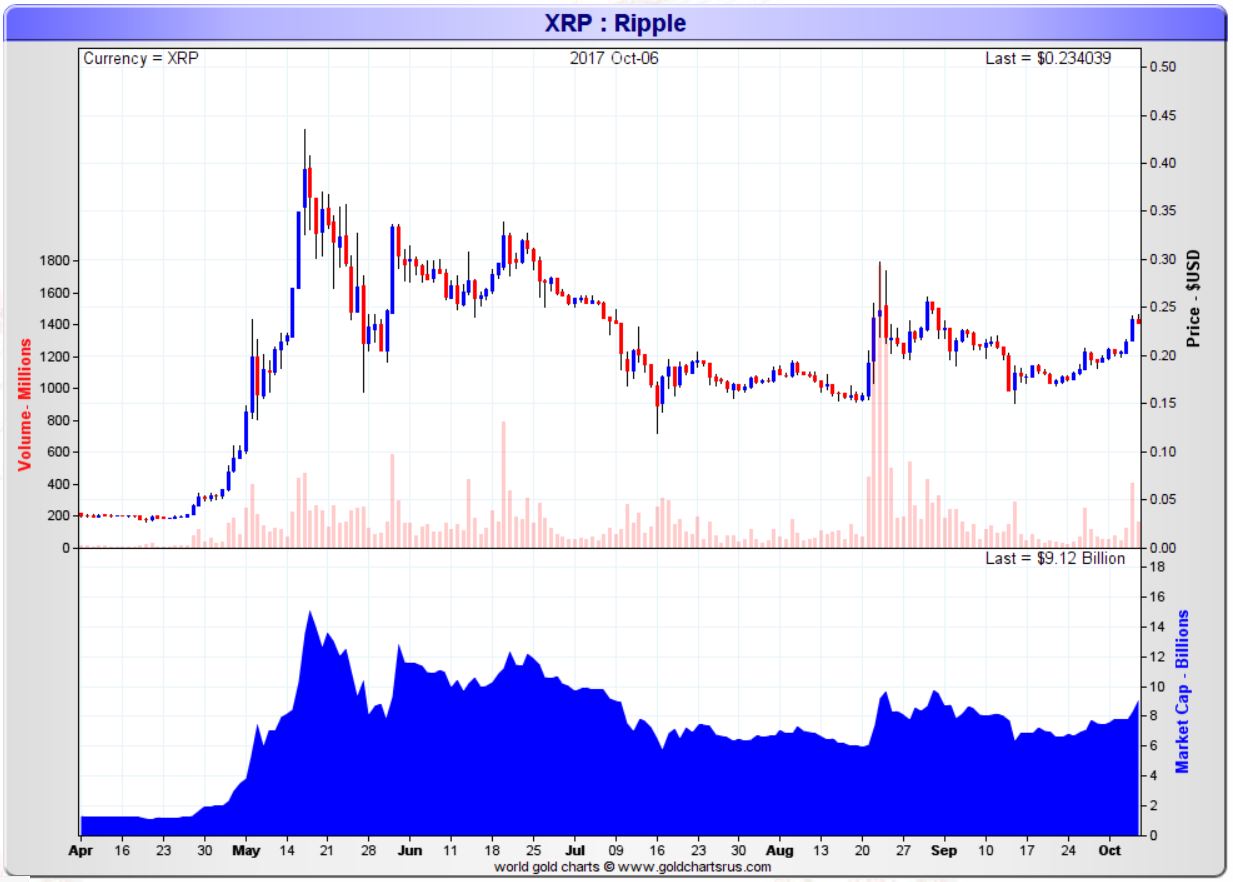
Ripple’s price chart looks awesome. It is very close to a mega breakout. However, investors should only get excited once a breakout is confirmed, the same goes for Ripple.
We wrote recently that Ripple’s price would be very bullish for 2018 once above 0.26 USD. And Ripple is very close to that price right now.
Ripple’s 6 month price chart (see below) makes that point though we did not add our usual annotations on this chart. A trendline could easily be drawn which would connect the peaks of June and August.
Moreover, Ripple has respected the $0.15 level. The chart shows a very solid support and that is always the basis for great future returns.
Whether “this time will be different” for Ripple, and whether this breakout attempt will be the “real deal” remains to be seen. One things is clear: Ripple is a great long term play and we it is a matter of time until it will rise again for reasons outlined in Why The Price Of Ripple Will Rise Above 0.50 USD In 2017.
Once Ripple goes above $0.26 it will probably accelerate and outpace other cryptocurrencies, according to us.
Chart courtesy: goldchartsrus.com
Ed. note: InvestingHaven is the first in the world to offer a Blockchain Investing Research service, subscribe now to get the top 3 to 5 tokens per year and our proprietary risk/reward score for all blockchain stocks trading on public exchanges.


