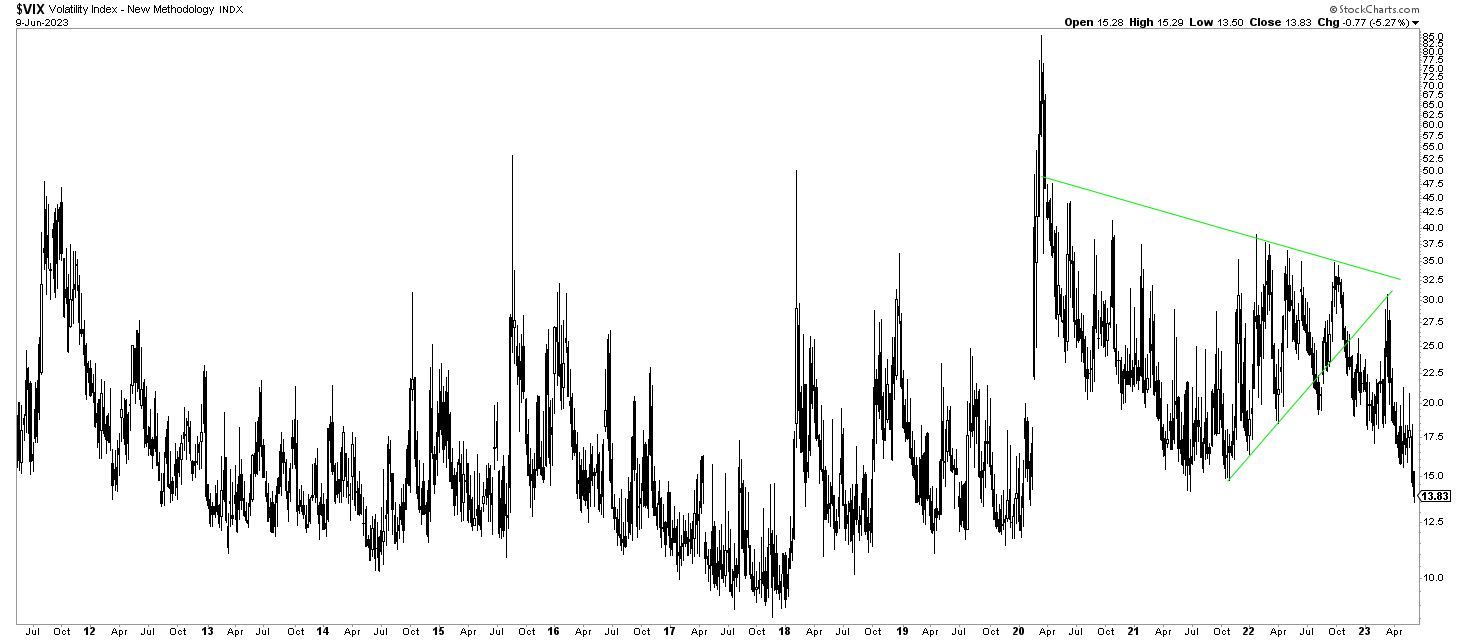
The stock market can be a labyrinth of indicators and signals, each providing valuable insights into the overall sentiment and potential market movements. One such indicator is the VIX, commonly known as the “Fear Index,” which measures market volatility. In this blog post, we will explore a fascinating analysis of the VIX chart over 12 years, as featured in our (no) stock market crash 2023 prediction published in November last year and updated today, focusing on a critical breakdown that marked the start of a new bull market.
We examine the sequence of events, the resistance encountered, and the implications for investors in navigating the market’s twists and turns in 2023.
Unraveling the VIX Chart
The VIX chart serves as a barometer of market volatility and investor sentiment. By studying its patterns and identifying significant events, we can gain valuable insights into market trends and potential turning points. Let’s dive into the details of the breakdown that occurred on October 13th and the subsequent developments that shaped the outlook for a new bull market.
The October 13th Breakdown
On October 13th, a significant event took place in the stock market as the S&P 500 Index (SPX) opened below 3500 points. This event triggered a wave of bearish sentiment, with many convinced that a crash was imminent. Interestingly, this pivotal moment coincided with a breakdown in the structure of the VIX. As investors turned bearish, the VIX started breaking down, signaling a potential shift in market dynamics.
The Rising Trendline as Resistance
Following the breakdown, the VIX embarked on a journey that revealed crucial resistance levels. In March 2023, the VIX experienced a spike, reaching the rising trendline that acted as a formidable barrier. This trendline, drawn from previous peaks, held true to its nature by resisting the VIX’s ascent. The encounter with this resistance further solidified the notion that a new bull market had emerged.
A Bull Market in the Making
The breakdown in the VIX’s structure on October 13th marked the starting point of a new bull market. Despite “bumps on the road,” such as waves of selling and volatility spikes, the long-term structure of the VIX chart suggests that the bull market will continue to dominate in 2023. This observation carries significant implications for investors seeking to navigate the market’s ups and downs with a strategic approach.
The Power of Market Sentiment
The breakdown in the VIX’s structure, accompanied by a bearish sentiment among investors, highlights the power of market sentiment and the need for careful analysis. Investor psychology plays a crucial role in market movements, and recognizing shifts in sentiment can help investors anticipate potential market trends.
Navigating the Road Ahead
As the VIX continues to fluctuate, investors must remain vigilant and adaptable. The “bumps on the road” in the form of waves of selling and volatility spikes should be expected, but they should not derail the overall trajectory of the bull market. Investors should focus on long-term strategies, disciplined risk management, and a thorough understanding of the broader market dynamics.
Conclusion
The breakdown in the structure of the VIX on October 13th marked the beginning of a new bull market. Despite encountering resistance at the rising trendline, the VIX’s long-term structure indicates that the bull market will continue to dominate in 2023. Understanding the interplay between market sentiment, key events, and the VIX chart can provide investors with valuable insights into navigating the market’s twists and turns. By staying focused, disciplined, and informed, investors can position themselves to ride the waves of volatility.


