Investing Haven
No Result
View All Result
Gold Silver Investing >>
CRYPTO INVESTING >>
  • 2025 Forecasts
    • 10 market predictions
    • Dow Jones forecast
    • S&P 500 forecast 2025
    • Nasdaq prediction 2025
    • Best altcoins to buy
    • Best crypto to buy now
    • Which crypto will explode
    • 15 crypto forecasts 2025
    • Which precious metal to buy
  • Silver
    • Silver prediction 2025 – 2030
    • Will silver exceed $30?
    • When will silver hit $50?
    • Can silver hit $100?
    • Silver shortage
    • 50-year silver chart
    • Silver bullish reversal
    • Silver seasonality charts
    • How to invest in silver
  • Gold
    • Gold prediction 2025 – 2030
    • Will gold set new ATH?
    • Will gold hit $3,000?
    • Can gold hit $10,000?
    • Gold chart 10 years
    • Gold chart 50 years
    • Gold chart 100 years
    • Gold silver ratio
    • Gold seasonality charts
  • Commodities
    • Coffee forecasts
    • Sugar forecasts
    • Nickel forecasts
    • Lithium investing
  • Crypto forecasts
    • BTC prediction 2025 – 2030
    • ETH prediction 2025 – 2030
    • SOL prediction 2025 – 2030
    • XRP prediction 2025 – 2030
    • XLM prediction 2025 – 2030
    • BNB prediction 2025 – 2030
    • ADA prediction 2025 – 2030
    • AVAX prediction 2025 – 2030
    • KAS prediction 2025 – 2030
    • NEAR prediction 2025 – 2030
    • BCH prediction 2025 – 2030
    • LINK prediction 2025 – 2030
    • DOT prediction 2025 – 2030
    • SUI prediction 2025 – 2030
    • ICP prediction 2025 – 2030
    • LTC prediction 2025 – 2026
    • STX prediction 2025 – 2030
    • DOGE prediction 2025 – 2030
    • SHIB prediction 2025 – 2030
    • PEPE prediction 2025 – 2030
    • FLOKI prediction 2025 – 2030
    • WIF prediction 2025 – 2030
    • ONDO prediction 2025 – 2030
  • News
    • Crypto news
    • Commodities
  • Login
Investing Haven
No Result
View All Result

Home » Markets & Stocks » The Most Epic Short Squeeze Of 2023 Might Be Underway

The Most Epic Short Squeeze Of 2023 Might Be Underway

The most epic short squeeze of 2023 might be underway. The chart of this heavily shorted stock screams BULLISH REVERSAL about to start soon.

Taki T. by Taki T.
September 18, 2023
in Markets & Stocks
short squeeze
1.9k
VIEWS
Share on FacebookShare on Twitter

In a financial world awash with information, staying focused on what truly matters is an art. Often, investors can become bogged down by an avalanche of data, news, and opinions, losing sight of the core driver of success: the chart. In this era of information overload, the chart remains a timeless and steadfast guide, cutting through the noise to reveal the essence of market sentiment. It’s easy to get caught up in the whirlwind of narratives, market gossip, and the constant buzz of financial media. However, seasoned investors know that the chart, with its unfiltered depiction of price action, is the ultimate arbiter. Case in point: this heavily shorted stock now has such a powerful bullish reversal that a short squeeze is only a matter of time (when, not if). We predict that this stock has the potential to qualify as THE most epic short squeeze of 2023.

The Power of Pure Chart Analysis

Consider this: a chart of a particular stock displays a robust and unmistakable bullish reversal. Without any prior knowledge of the stock’s symbol or its financial particulars, most investors would concur on this point. The chart, in essence, provides a universally understood language that transcends the complexities of financial jargon and corporate reports. It speaks directly to the fundamental emotions of fear and greed that drive markets.

The Narrative Trap Does Not Reveal a Potential Short Squeezes

However, once the stock symbol is revealed, a curious shift often occurs. The power of the chart gives way to the dominating force of narrative. The symbol triggers a cascade of associations in the investor’s mind – past experiences, news stories, opinions from analysts, and perhaps even rumors from social media. Suddenly, the clean lines and patterns on the chart are obscured by a fog of preconceived notions.

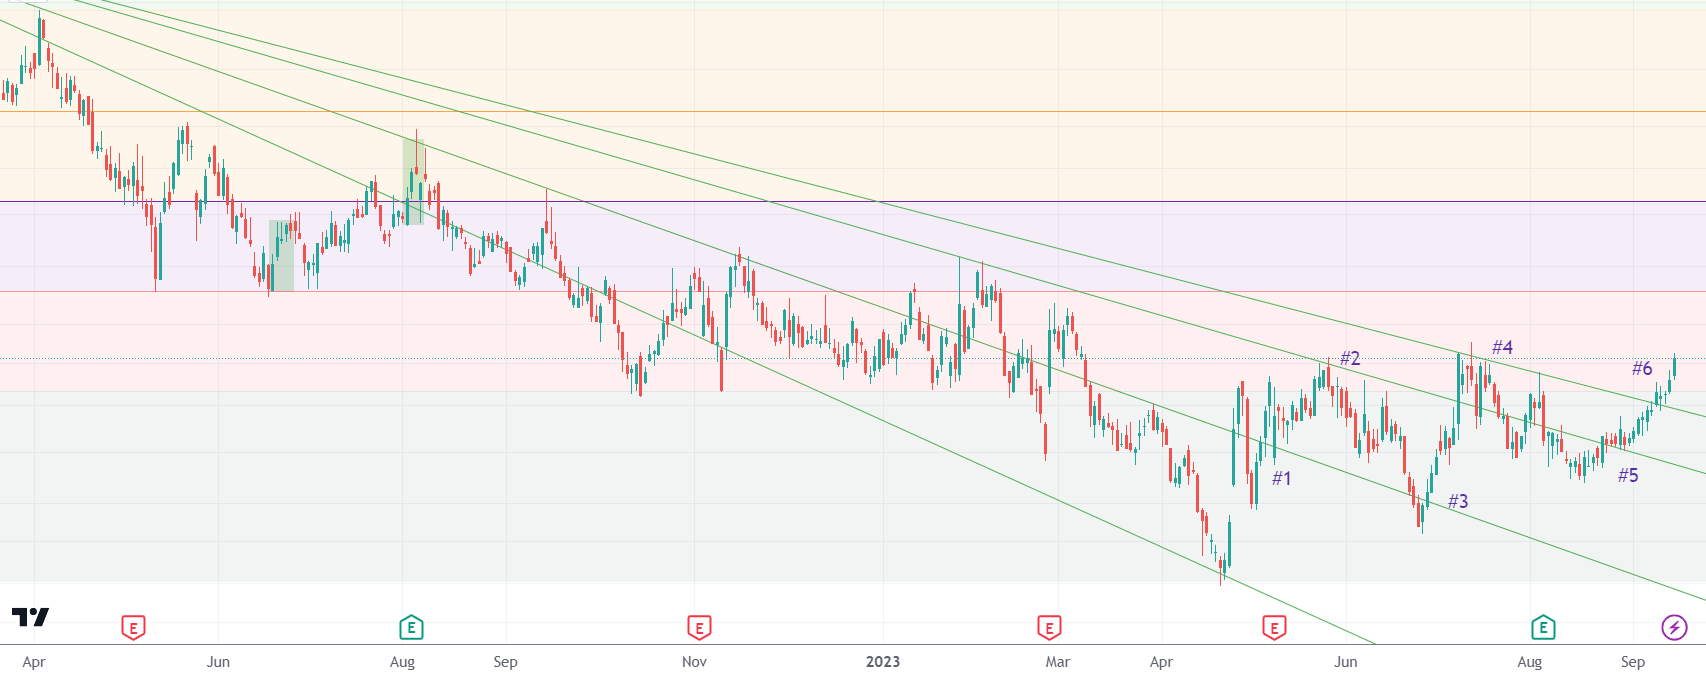
Starting with the Chart to see the coming Short Squeeze

This phenomenon underscores the importance of a simple yet profound mantra: “Start with the chart.” Seasoned investors understand that while narratives can be persuasive and even seductive, they can also be deceptive. The chart, on the other hand, is an impartial observer of market behavior. It doesn’t care about rumors, opinions, or the latest headlines. It tells the unvarnished truth about price movements and, by extension, market sentiment.

Let’s do a short version of the chart analysis, after adding our chart annotations:

  • Bulls are clearing multiple falling trendlines, one by one, in the last 6 months.
  • What was considered an epic breakdown, back in April, turned out be an inverted H&S pattern, which is a bullish chart pattern.
  • In the last 10 trading days, when leading stock indexes were relatively weak, this stock has printed a series of 10 green candles, some of them around 4 to 5 pct.

Do you need any more evidence to understand that this stock is eyeing the 50% retracement level, which is the fine purple line on the chart, a rise of 100%?

In an age where information is abundant but attention spans are fleeting, it’s easy to lose sight of the fundamentals of successful investing. The allure of a compelling narrative can lead investors down a rabbit hole of overthinking and second-guessing. The most epic short squeeze of 2023 (meaning), or any significant market event, might be unfolding right before our eyes, hidden in plain sight on the chart. It’s a reminder that in the noisy world of finance, sometimes the most powerful insights are the simplest ones: start with the chart.

This article, in the public post, is intended to be educational. For readers that require the specifics, like the symbol and more detailed chart analysis as well as targets, we suggest to read the weekend alert shared earlier today in the Momentum Investing premium service: The Market Is Coming Our Way >>

10-YEAR ANNIVERSARY OFFER: InvestingHaven.com celebrates 10 years. Temporarily, you can enjoy a discount on our premium gold/silver and crypto reports. Or you can become a VIP member. Go to our anniversary deals >>
Receive our weekly newsletter.

premium service SP-500 premium service trade alerts premium service crypto teaser 

No related posts.

Taki T.

Taki T.

Taki is a chart analyst who is passionate about unlocking unique insights out the chart. While the vast majority of analysts remain focused on price analysis, Taki starts with timeline analysis and adds price analysis to this. In doing so, he developed a unique methodology to find opportunities in financial markets, across assets and markets.

Connect with InvestingHaven

Receive top notch forecasts for free.

*We hate spam as you do.

Site Navigation

  • RSS Feed
  • About us
  • Advertising
  • Sponsored Content Policy
  • Mission 2026
  • Sitemap
  • Privacy & Disclaimer
  • Terms of Service
  • Contact Us
investing haven logo

Precious metals market analysis including gold and silver price predictions. Crypto market analysis including highly accurate BTC ETH SOL XRP forecasts.

Copyright © 2025 InvestingHaven

Login to your account below

Forgotten Password?

Fill the forms bellow to register

All fields are required. Log In

Retrieve your password

Please enter your username or email address to reset your password.

Log In

Receive top notch forecasts for free.

*We hate spam as you do.

No Result
View All Result
  • News
  • 2025 Forecasts
    • 10 market predictions
    • Dow Jones forecast 2025
    • S&P 500 forecast 2025
    • Nasdaq prediction 2025
    • Best crypto to buy now
    • Which crypto will explode
    • Best altcoins to buy
    • 15 crypto forecasts 2025
    • Which precious metal to buy
  • Silver articles
    • Silver prediction 2025 – 2030
    • Will silver exceed $30?
    • When will silver hit $50?
    • Can silver hit $100?
    • Silver shortage
    • 50-year silver chart
    • Silver bullish reversal
    • Silver seasonality charts
    • How to invest in silver
  • Gold
    • Gold prediction 2025 – 2030
    • Will gold set new ATH?
    • Will gold hit $3,000?
    • Can gold hit $10,000?
    • Gold chart 10 years
    • Gold chart 50 years
    • Gold chart 100 years
    • Gold silver ratio
    • Gold seasonality charts
  • Commodities
    • Sugar forecasts
    • Coffee forecasts
    • Nickel forecasts
    • Lithium investing
  • Crypto news
  • Crypto forecasts
    • BTC prediction 2025 – 2030
    • ETH prediction 2025 – 2030
    • SOL prediction 2025 – 2030
    • XRP prediction 2025 – 2030
    • XLM prediction 2025 – 2030
    • BNB prediction 2025 – 2030
    • ADA prediction 2025 – 2030
    • AVAX prediction 2025 – 2030
    • KAS prediction 2025 – 2030
    • NEAR prediction 2025 – 2030
    • BCH prediction 2025 – 2030
    • LINK prediction 2025 – 2030
    • DOT prediction 2025 – 2030
    • SUI prediction 2025 – 2030
    • ICP prediction 2025 – 2030
    • LTC prediction 2025 – 2026
    • STX prediction 2025 – 2030
    • DOGE prediction 2025 – 2030
    • SHIB prediction 2025 – 2030
    • PEPE prediction 2025 – 2030
    • FLOKI prediction 2025 – 2030
    • WIF prediction 2025 – 2030
    • ONDO prediction 2025 – 2030
  • Premium Crypto Alerts
  • Premium services

Copyright © 2025 InvestingHaven