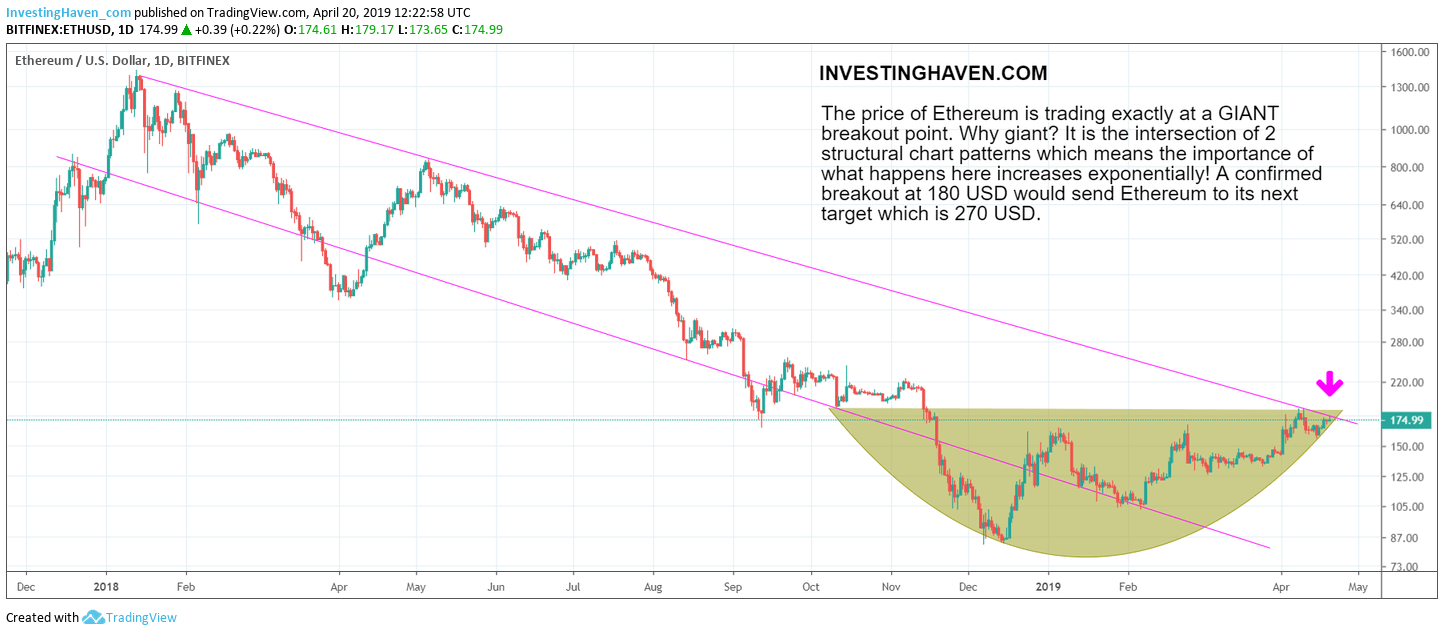
Ethereum (ETH) went through a rollercoaster ride in the last 15 months. It showed periods of relative strength and relative weakness, but to a larger degree than most other large cryptocurrencies. Right now, it sits at the intersect of two major and structural chart patterns. It trades at a giant breakout level. If our cryptocurrency predictions come true the new crypto bull market will result in a giant breakout of the price of Ethereum. Next to Bitcoin’s long term bullish chart we might add Ethereum anytime soon as a bullish crypto chart.
As said in our 50 cryptocurrency investing tips investors better take some small positions and let the super growth potential work for them especially in high risk investments. That is far better than taking a large position with a “get-quick-rich” mindset.
Cryptocurrencies that are highly volatile require a trading approach as per the ‘less is more‘ principle. Trading less will result in significantly higher profits provided timing a trade is accurate.
Ethereum enthusiasts should be on a high alert now, this is why.
Ethereum Price Chart At Giant Breakout Level
The annotated chart of Ethereum embedded in this article says it all.
Ethereum has been trading for 90% of the time in its bear market channel. From time to time it showed exceptional relative weakness like in April and December last year.
Interestingly, it showed relative strength last year in May.
Now, however, we see a totally different picture: a giant breakout in the making.
Ethereum arrived at the intersection of the falling channel and the rounding bottom. One long term chart set up is crucially important, but the intersection of two crucial chart setups has an exponentially higher value!
Any breakout above 180 USD for 3 consecutive days will send Ethereum to 270 USD later this year.


