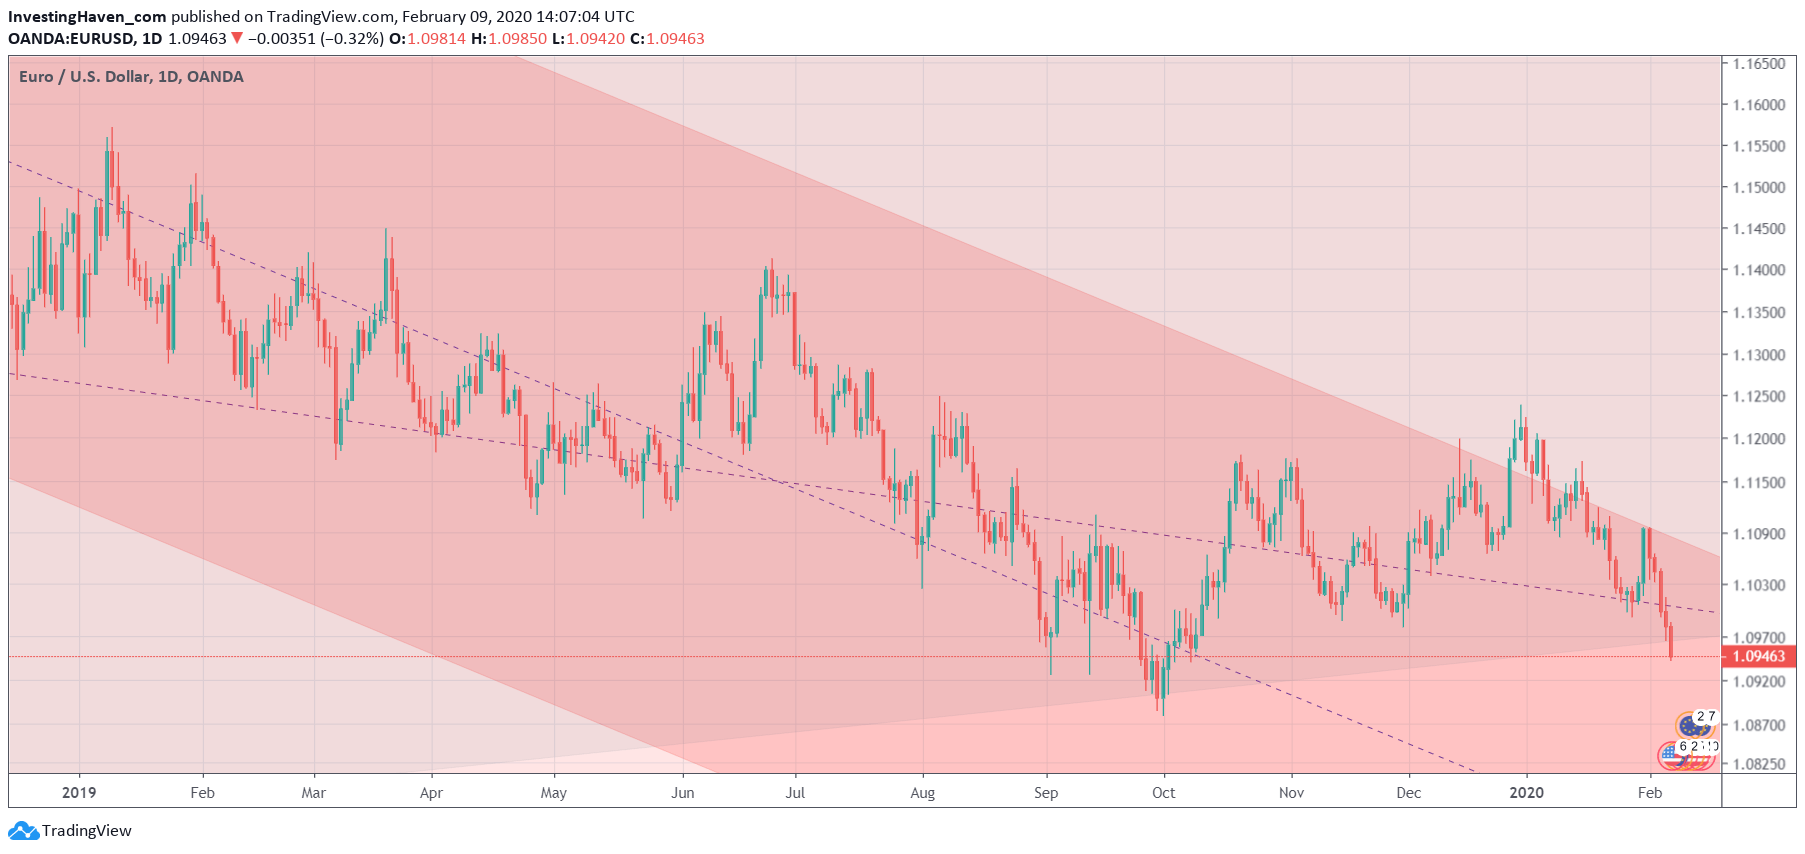
January of 2020 was a hell of a month for analysts and most investors/traders. We identified 3 different (opposing) trends in one month. Markets going crazy? Maybe but in the end that’s not important. All that matters is positions and profits/losses. How many of our forecasts are still valid? Are stocks bullish in 2020? Is gold the safe haven to hold in 2020? One thing seems clear in figuring out answers: the Euro chart is raising a red flag ‘as we speak’, we don’t ignore this over here at InvestingHaven.
We still believe our bullish stock forecast for 2020 is valid.
We also still believe that gold is in a new bull market, one that started in June of 2019.
Interestingly the Euro chart is raising a red flag, and one that goes against bullish stocks and bullish gold forecasts.
Below we feature a fragment of the many dozens of (much longer term and richly annotated) charts from our Momentum Investing chartlist. This is a chartlist used in our proprietary forecasting methodology which is designed to help us turn 10k into 1M by 2026, as per our Mission 2026.
We are not going to explain the details of this chart, the trends and colors. They are part of the proprietary methodology.
What we want to point out is that the Euro better respects current levels. Any break below October lows will trigger selling in stocks as well as in commodities.
However, the million dollar question is how much more downside there is, and how other leading indicators react to a potentially weakening Euro.
Today we want to point out that 1.088 is a critical level on the Euro chart, it is the line in the sand for the short term!


