We completed our monthly research on the dominant market trend as per our 15 leading indicators. One of the key findings is that both European and emerging market stocks are at a major pivot. They can become bullish or bearish in 2019, they are in neutral territory right now. Find specific buy and sell price points for 2019 for both European and emerging stock markets.
In our set of 100 investing tips we have this one specific tip on price points on charts:
Only a very limited number of price points have a decisive meaning. It is crucial to identify those critical price points, and actively use them in determining entry and exit points. Applied successfully and consistently it will deliver above average profits over time.
So let’s apply the findings from our dominant trend research with the 1/99 investing principle that just 1% of price points have a predictive value.
In other words for peace of mind investors should have a handful of price points that they track in the big picture market trend. Moreover, it is monthly closes that are important to determine dominant trends. This allows for more controlled investing decisions. This is what investors need in a world of information overload and social media.
Counterintuitively, it is less effort of investors that is required to track markets, not more effort. Forget about following the endless stream of news of Europen stock markets or emerging stock markets. The key is to find the trends as well as the cut off points like buy and sell points.
Buy and sell price points for emerging and European stock markets
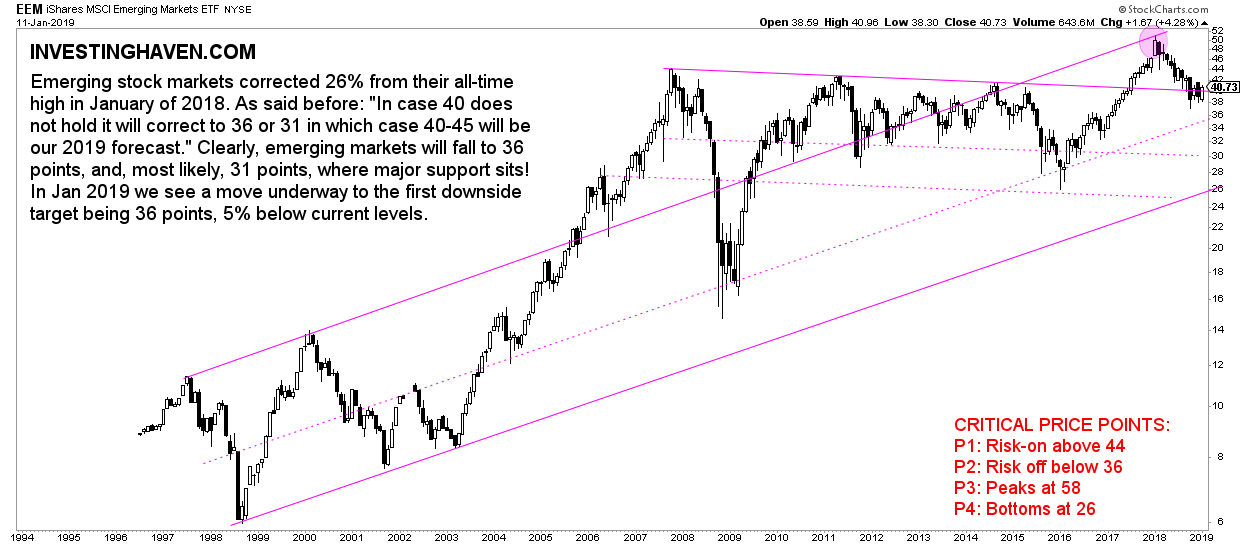
Emerging markets stocks retraced in the last 12 months. They are not building a solid base at their breakout point. This is not bearish nor bullish at this point in time.
As per our new chart format we depict the price points that matter per market. For emerging markets:
- Risk on once EEM ETF rises above 44 points (monthly close).
- Risk off once EEM ETF falls below 36 points (monthly close).
- If and once the new bull market is there look for an (intermediate) top at 58 points.
- If and once a bear market would occur look for a major bottom at 26 points.
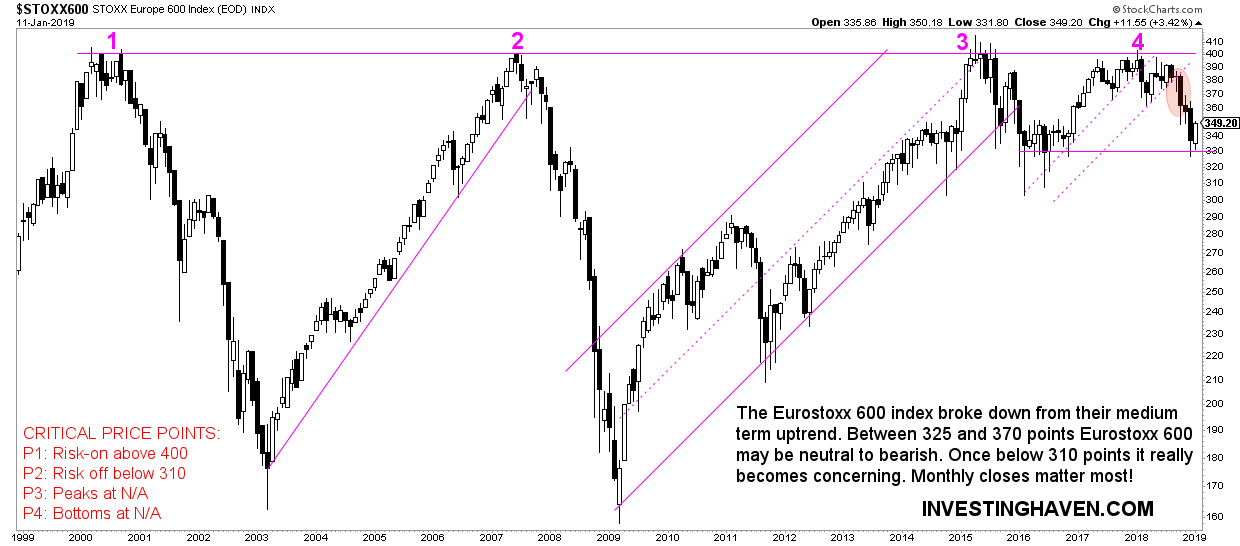
We see a very similar view for European stocks. They are in neutral territory, they might become bullish or bearish but only if and once specific price points are (b)reached.
As per our new chart format we depict the price points that matter per market. For European stock markets:
- Risk on once STOXX rises above 400 points (monthly close).
- Risk off once STOXX falls below 310 points (monthly close).
- If and once the new bull market is we have to evaluate the pattern that will arise to identify an (intermediate) top. Impossible to do so with the current data at hand.
- If and once a bear market would occur look for a major bottom between 210 and 280 points.


