Investing Haven
No Result
View All Result
Gold Silver Investing >>
CRYPTO INVESTING >>
  • 2025 Forecasts
    • 10 market predictions
    • Dow Jones forecast
    • S&P 500 forecast 2025
    • Nasdaq prediction 2025
    • Best altcoins to buy
    • Best crypto to buy now
    • Which crypto will explode
    • 15 crypto forecasts 2025
    • Which precious metal to buy
  • Silver
    • Silver prediction 2025 – 2030
    • Will silver exceed $30?
    • When will silver hit $50?
    • Can silver hit $100?
    • Silver shortage
    • 50-year silver chart
    • Silver bullish reversal
    • Silver seasonality charts
    • How to invest in silver
  • Gold
    • Gold prediction 2025 – 2030
    • Will gold set new ATH?
    • Will gold hit $3,000?
    • Can gold hit $10,000?
    • Gold chart 10 years
    • Gold chart 50 years
    • Gold chart 100 years
    • Gold silver ratio
    • Gold seasonality charts
  • Commodities
    • Coffee forecasts
    • Sugar forecasts
    • Nickel forecasts
    • Lithium investing
  • Crypto forecasts
    • BTC prediction 2025 – 2030
    • ETH prediction 2025 – 2030
    • SOL prediction 2025 – 2030
    • XRP prediction 2025 – 2030
    • XLM prediction 2025 – 2030
    • BNB prediction 2025 – 2030
    • ADA prediction 2025 – 2030
    • AVAX prediction 2025 – 2030
    • KAS prediction 2025 – 2030
    • NEAR prediction 2025 – 2030
    • BCH prediction 2025 – 2030
    • LINK prediction 2025 – 2030
    • DOT prediction 2025 – 2030
    • SUI prediction 2025 – 2030
    • ICP prediction 2025 – 2030
    • LTC prediction 2025 – 2026
    • STX prediction 2025 – 2030
    • DOGE prediction 2025 – 2030
    • SHIB prediction 2025 – 2030
    • PEPE prediction 2025 – 2030
    • FLOKI prediction 2025 – 2030
    • WIF prediction 2025 – 2030
    • ONDO prediction 2025 – 2030
  • News
    • Crypto news
    • Commodities
  • Login
Investing Haven
No Result
View All Result

Home » Markets & Stocks » Forecasting Secret Revealed: 2 Leading Indicators

Forecasting Secret Revealed: 2 Leading Indicators

Taki T. by Taki T.
August 5, 2023
in Markets & Stocks
market forecast 2017
2.5k
VIEWS
Share on FacebookShare on Twitter

‘The art of the chart’ is how we tend to describe chart analysis. It is the basis for all our forecasts. As per our 100 investing tips the real secret behind all this is that every forecast requires a different chart analysis angle. That’s why it’s not easy to consistently forecast accurately. As per requests of many followers we reveal one secret of how we forecast stock market turning points. This is also the forecasting method underlying our 15 Leading Indicators For The Dominant Market Trend as well as the method we apply to determine the timing of our TOP 3 Investing Opportunities Of 2019.

The reason why this topic is so important has to do with the dangers of investing. As explained in great detail in 10 Tips To Master Investing Without Emotions it is emotions that will play against you. Yes, this applies to each and every investor on this planet. The only way to overcome this risk related to emotions is by neutralizing it by using (advanced) chart analysis.

It is in the context of chart analysis that a set of leading indicators can be identified.

One small secret which we will reveal today is about the leading indicators we use for forecasting stock market trends, especially in the U.S.

The secret about forecasting U.S. stock markets and turning points is to properly use 3 charts and leading indicators. First, on the highest level and longest timeframe, the 10 year Yields  determine the multi-quarter risk on / risk off direction of stock markets as they move from top to bottom in rising or falling channels. Second, on a multi-year timeframe, the Russell 2000 to S&P 500 ratio determines the turning points based on breakout and breakdown patterns. Third, on an intra-year basis, the Russell 2000 to 10 year Yields ratio determines the turning points based on breakout and breakdown patterns.

Note that we will only reveal a secret like this one once in the public domain!

As seen in above  quote it is a combination of things that is required to forecast trends in U.S. stock markets:

  1. Identifying the relevant leading indicators (the ones that deliver accurate results consistently).
  2. Extending the leading indicators for different timeframes.
  3. Identifying which chart analysis pattern and method applies for each leading indicator.

To illustrate this we include two examples.

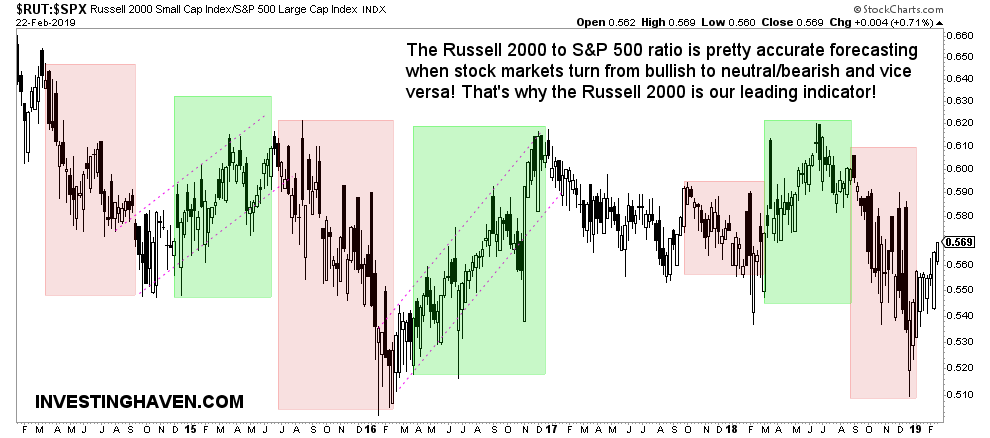
First, the Russell 2000 to S&P 500 ratio determines the turning points based on breakout and breakdown patterns.

As seen, we use the weekly chart. The visible patterns of higher lows and lower highs is the pattern that is relevant for this leading indicator!

2 leading indicators for forecasting

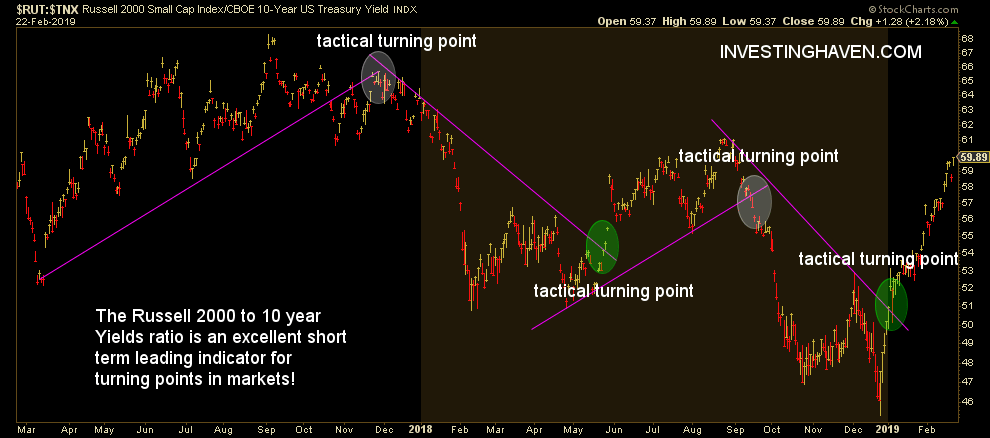
Second, the Russell 2000 to S&P 500 ratio determines the turning points based on breakout and breakdown patterns. Third, on an intra-year basis, the Russell 2000 to 10 year Yields ratio determines the turning points based on breakout and breakdown patterns.

As seen, we use the daily chart. The pattern of breakouts and breakdowns are the ones that are relevant in this context!

2 leading indicators for forecasting


The problem with investing tips is that most people start with sites that also have a commercial purpose. Investopedia, although a respected and giant site, is known to have so many links to brokers and other commercial affiliated services that it becomes tricky to differentiate the real content from commercial content. This Investing 101 tutorial makes the point.

This tutorial does even not talk about charts and chart analysis whatsoever. How on earth are you able to spot TOP investing opportunities without charts?

Note that we are so convinced about our work and the outcome of applying these 100 investing tips that we believe we deserve a spot in this blog post about top investing blogs with top tips in all humbleness.

Ed. note: Want to stay on par with the rhythm of markets? Subscribe to our weekly forecasting newsletter to receive all our updates for free! 

10-YEAR ANNIVERSARY OFFER: InvestingHaven.com celebrates 10 years. Temporarily, you can enjoy a discount on our premium gold/silver and crypto reports. Or you can become a VIP member. Go to our anniversary deals >>
Receive our weekly newsletter.

premium service SP-500 premium service trade alerts premium service crypto teaser 

No related posts.

Taki T.

Taki T.

Taki is a chart analyst who is passionate about unlocking unique insights out the chart. While the vast majority of analysts remain focused on price analysis, Taki starts with timeline analysis and adds price analysis to this. In doing so, he developed a unique methodology to find opportunities in financial markets, across assets and markets.

Connect with InvestingHaven

Receive top notch forecasts for free.

*We hate spam as you do.

Site Navigation

  • RSS Feed
  • About us
  • Advertising
  • Sponsored Content Policy
  • Mission 2026
  • Sitemap
  • Privacy & Disclaimer
  • Terms of Service
  • Contact Us
investing haven logo

Precious metals market analysis including gold and silver price predictions. Crypto market analysis including highly accurate BTC ETH SOL XRP forecasts.

Copyright © 2025 InvestingHaven

Login to your account below

Forgotten Password?

Fill the forms bellow to register

All fields are required. Log In

Retrieve your password

Please enter your username or email address to reset your password.

Log In

Receive top notch forecasts for free.

*We hate spam as you do.

No Result
View All Result
  • News
  • 2025 Forecasts
    • 10 market predictions
    • Dow Jones forecast 2025
    • S&P 500 forecast 2025
    • Nasdaq prediction 2025
    • Best crypto to buy now
    • Which crypto will explode
    • Best altcoins to buy
    • 15 crypto forecasts 2025
    • Which precious metal to buy
  • Silver articles
    • Silver prediction 2025 – 2030
    • Will silver exceed $30?
    • When will silver hit $50?
    • Can silver hit $100?
    • Silver shortage
    • 50-year silver chart
    • Silver bullish reversal
    • Silver seasonality charts
    • How to invest in silver
  • Gold
    • Gold prediction 2025 – 2030
    • Will gold set new ATH?
    • Will gold hit $3,000?
    • Can gold hit $10,000?
    • Gold chart 10 years
    • Gold chart 50 years
    • Gold chart 100 years
    • Gold silver ratio
    • Gold seasonality charts
  • Commodities
    • Sugar forecasts
    • Coffee forecasts
    • Nickel forecasts
    • Lithium investing
  • Crypto news
  • Crypto forecasts
    • BTC prediction 2025 – 2030
    • ETH prediction 2025 – 2030
    • SOL prediction 2025 – 2030
    • XRP prediction 2025 – 2030
    • XLM prediction 2025 – 2030
    • BNB prediction 2025 – 2030
    • ADA prediction 2025 – 2030
    • AVAX prediction 2025 – 2030
    • KAS prediction 2025 – 2030
    • NEAR prediction 2025 – 2030
    • BCH prediction 2025 – 2030
    • LINK prediction 2025 – 2030
    • DOT prediction 2025 – 2030
    • SUI prediction 2025 – 2030
    • ICP prediction 2025 – 2030
    • LTC prediction 2025 – 2026
    • STX prediction 2025 – 2030
    • DOGE prediction 2025 – 2030
    • SHIB prediction 2025 – 2030
    • PEPE prediction 2025 – 2030
    • FLOKI prediction 2025 – 2030
    • WIF prediction 2025 – 2030
    • ONDO prediction 2025 – 2030
  • Premium Crypto Alerts
  • Premium services

Copyright © 2025 InvestingHaven