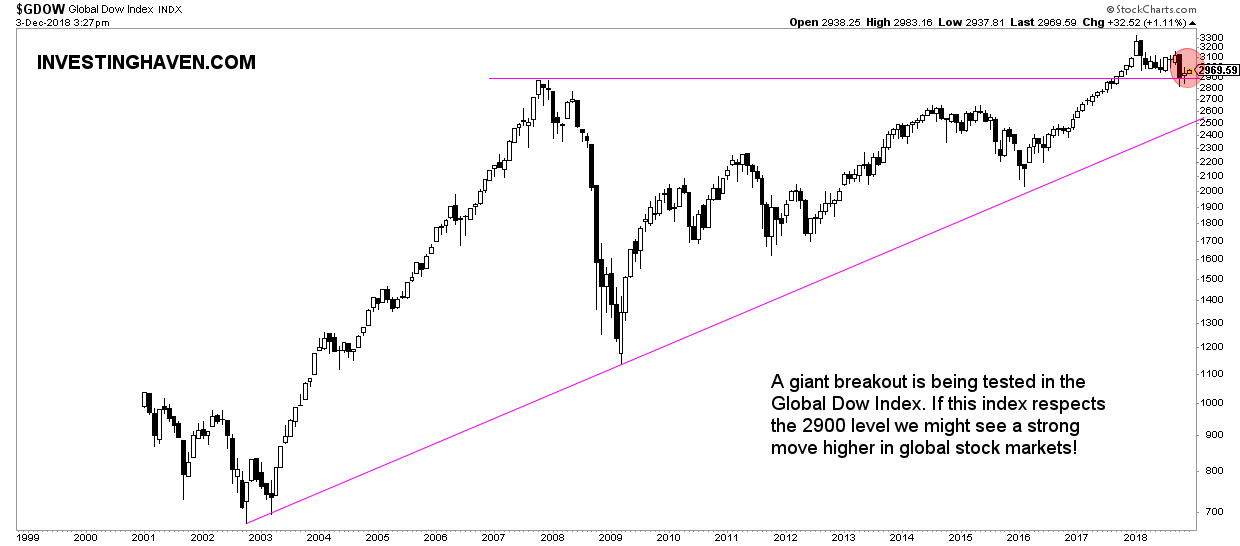
It might be that global stock markets are about to start a bullish cycle. How can we say this after such a tough and volatile year? Very simple, the global stock market index has a giant bullish chart setup which, if tested successfully, will get bullish energy. This might be the catalyst for our 5 top stock forecasts for 2019 as well as our emerging markets forecast for 2019.
As expected, stock markets go up and the stock market news becomes bullish again.
We are not interested in short term price movements and news headlines. We look at the big picture trends. When we check global stock market trends we see something very enticing.
The global stock market index, symbol GDOW, has a giant bullish chart setup. Note, the market has to confirm its bullish setup by not falling below 2880 points, it now trades at 2969.
As seen on the chart below the former highs of 2007 were successfully tested recently. It is now crucial to stay above this level. Why? Because, in chart terms, this recent correction would qualify as a successful backtest of the breakout above former all-time highs which took place last year.
Stated differently, 2018 may have been volatile, but it might be a bullish way to confirm a giant breakout. If that’s the case we will be looking at a small blip on the long term charts in a couple of years from now, looking back at the great buy opportunity that was presented to investors by the market in 2018.
Time will tell, but today’s price action in global markets was encouraging, and should continue for a couple of weeks to make it back to the January 2018 highs.
Courtesy of Chris Ciovacco in this stock market video for bringing this chart setup to our attention.


