Exceptionally, we publish an excerpt from our premium research service which features detailed and unique analysis on volatility indexes as a complement to our market readings. A new quarter is starting and it coincides with a new 3 month cycles. How do we read markets at the start of this new quarter and 3 month cycle?
In our premium research service, we feature a unique analysis on 6 distinct volatility indexes. We complement it with S&P 500 readings. Combined, we get a good sense of where markets are and the likely path forward.
Note that it is exceptional that we publish such a long excerpt from our premium service research. We do this, exceptionally, to let our readers know the depth and uniqueness of the research from our premium service(s).
In closing, we want to remind readers that at least 99% of analysts are looking at price only. We firmly believe that time + price is what matters. That’s because the charts have 2 axes. If you focus on price only it is like driving a car with 2 wheels. You are missing out on speed and accuracy in doing so.
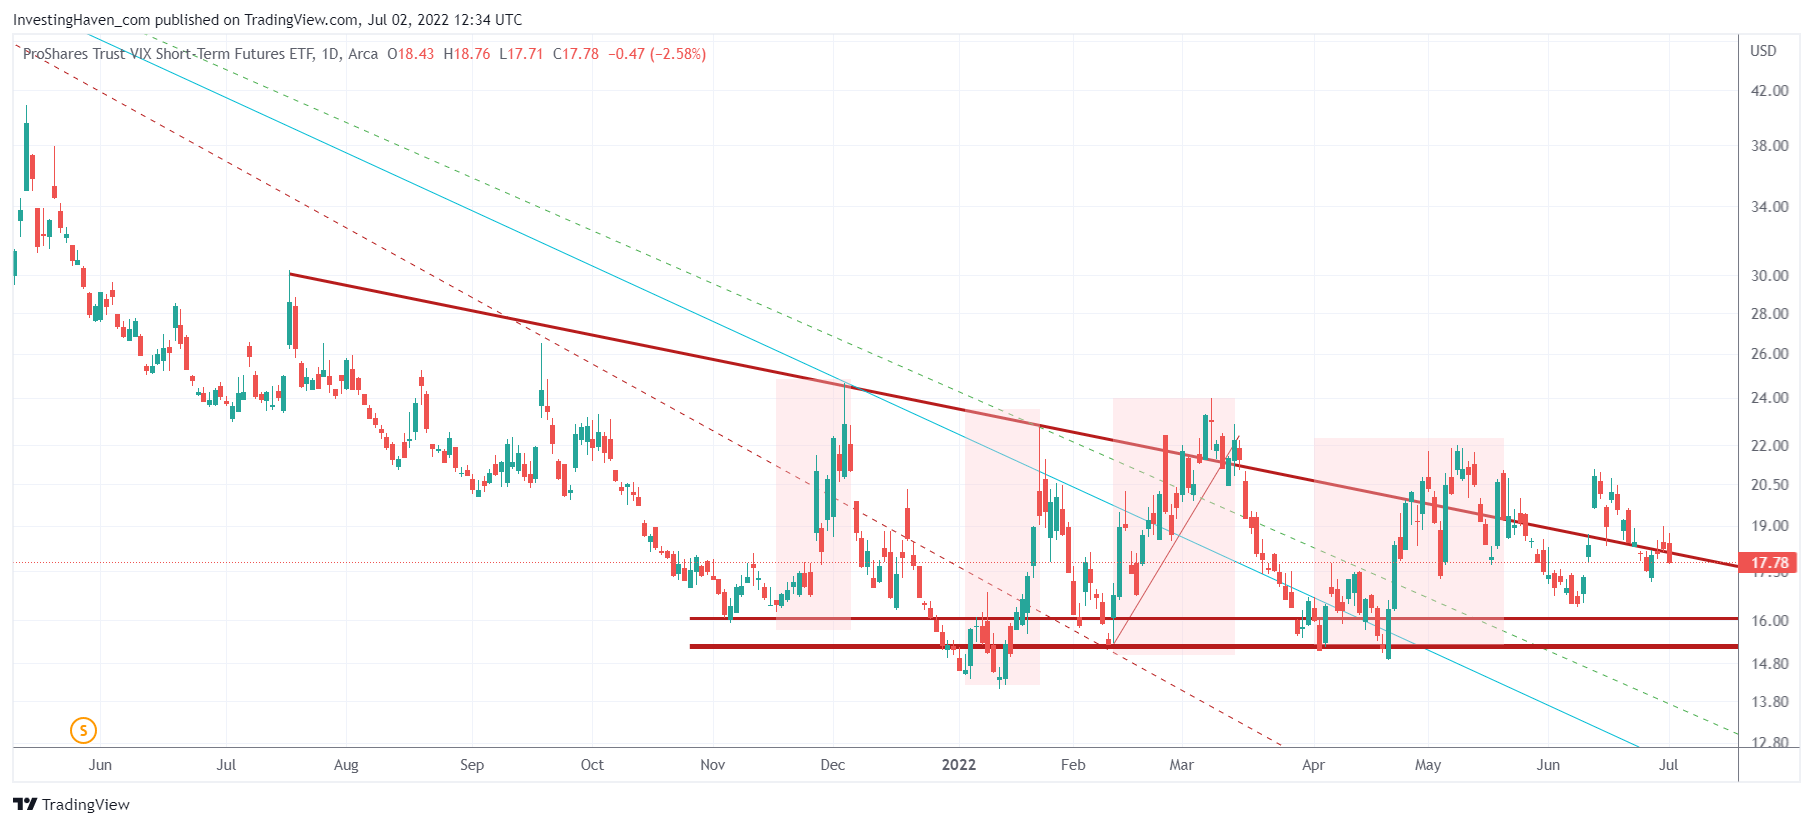
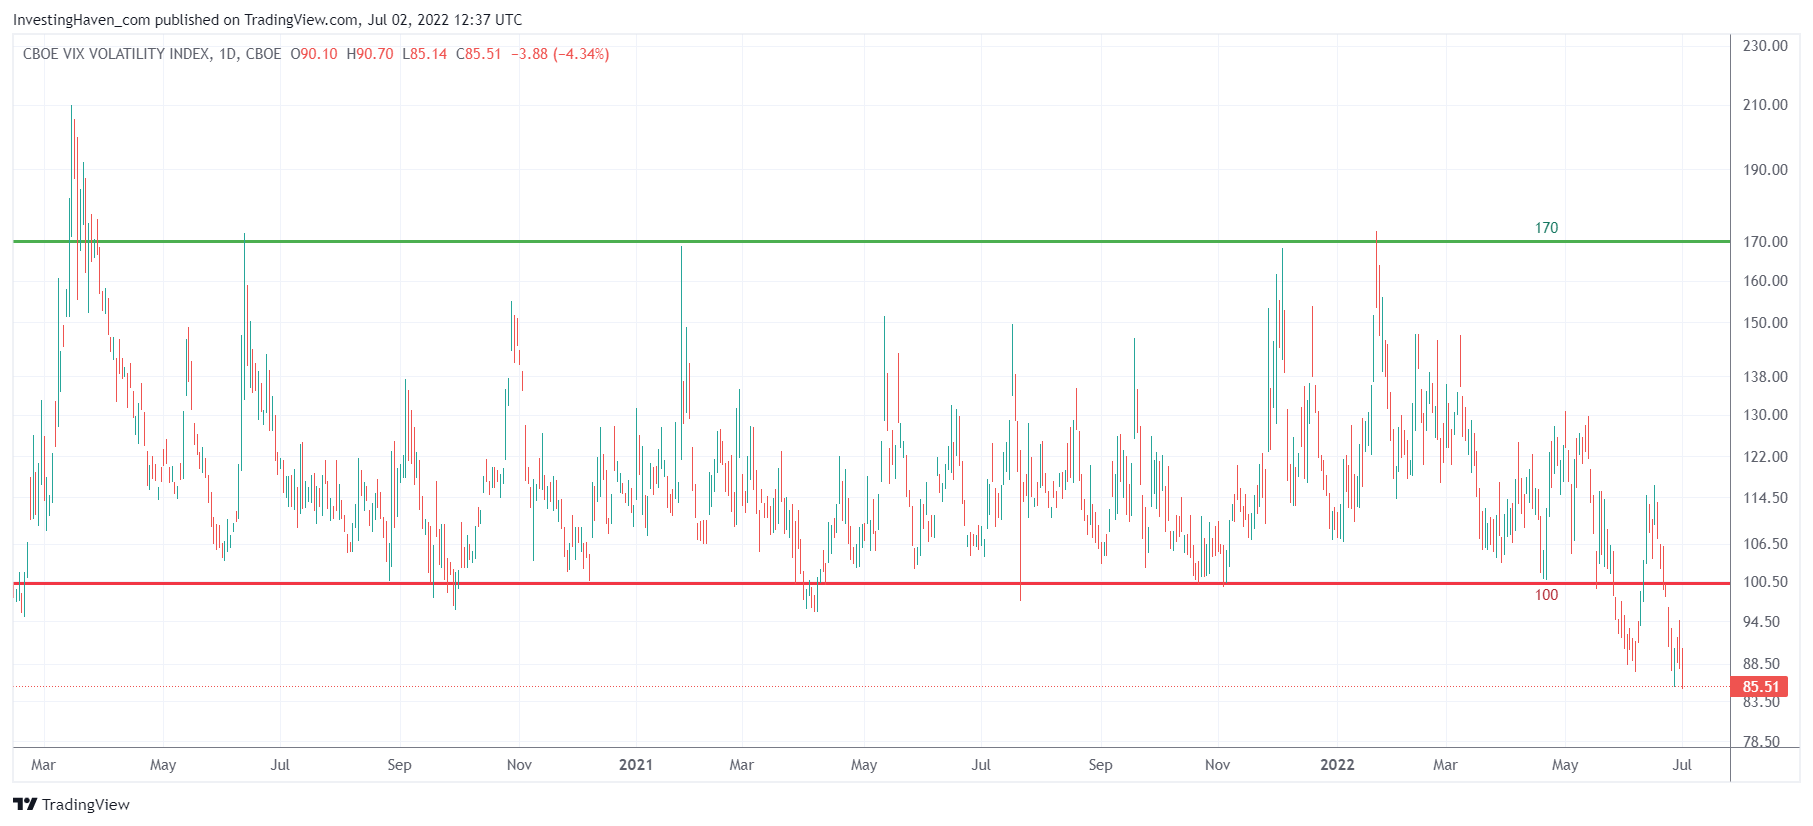
Volatility index #1. The short term volatility index is now back at the 12 month trendline. This setup is absolutely nerve-wracking: a sideways volatility index for 12 full months is absolutely unique and it explains the uncertainty since last November.
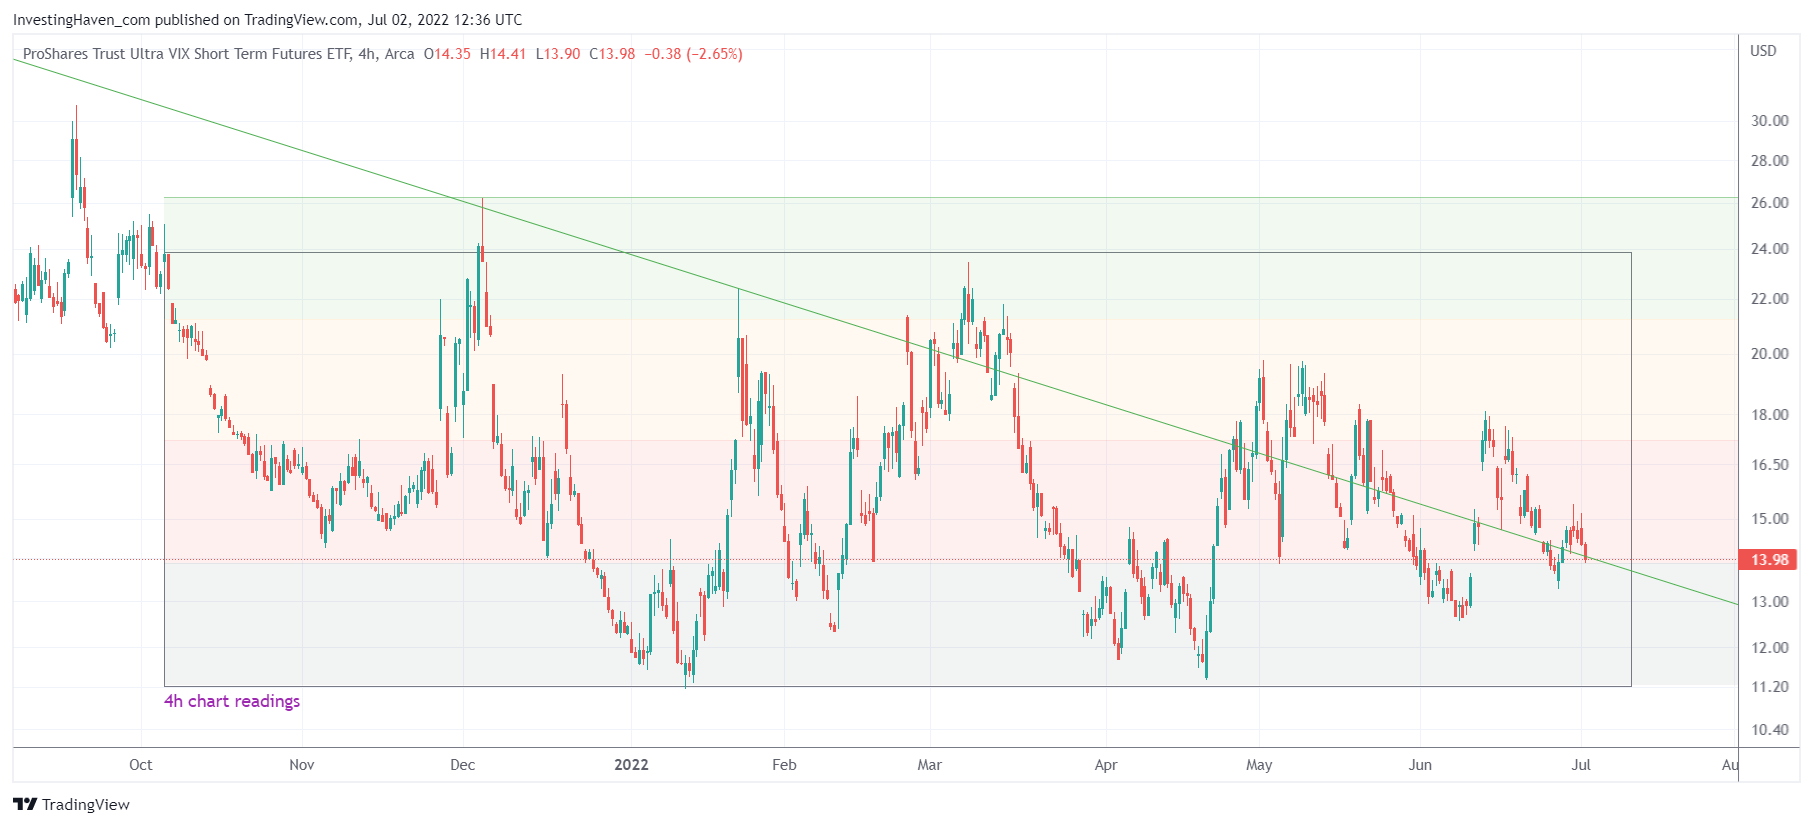
Volatility index #2. The ultra short term volatility index simply confirms what the short term volatility index is showing.
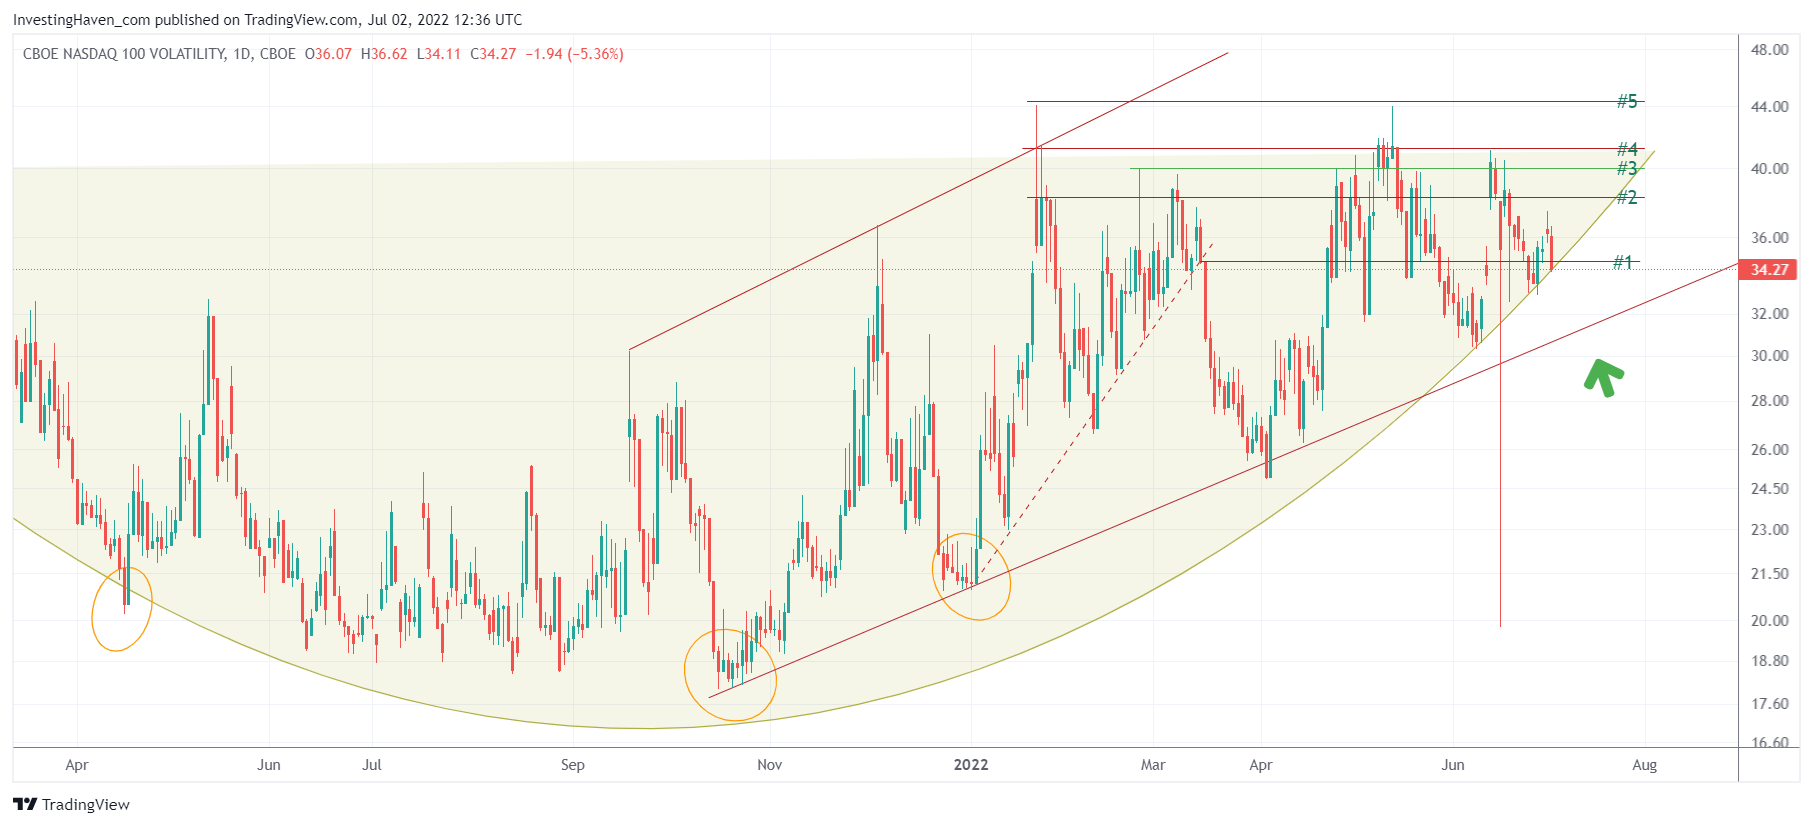
Volatility index #3. The Nasdaq volatility index is pushing against the edges of a long term rounded pattern. A tiny move lower comes with a breakdown. Conclusion: if the USD goes just a little lower it will come with a big bounce in the Nasdaq as the Nasdaq volatility index will break down.
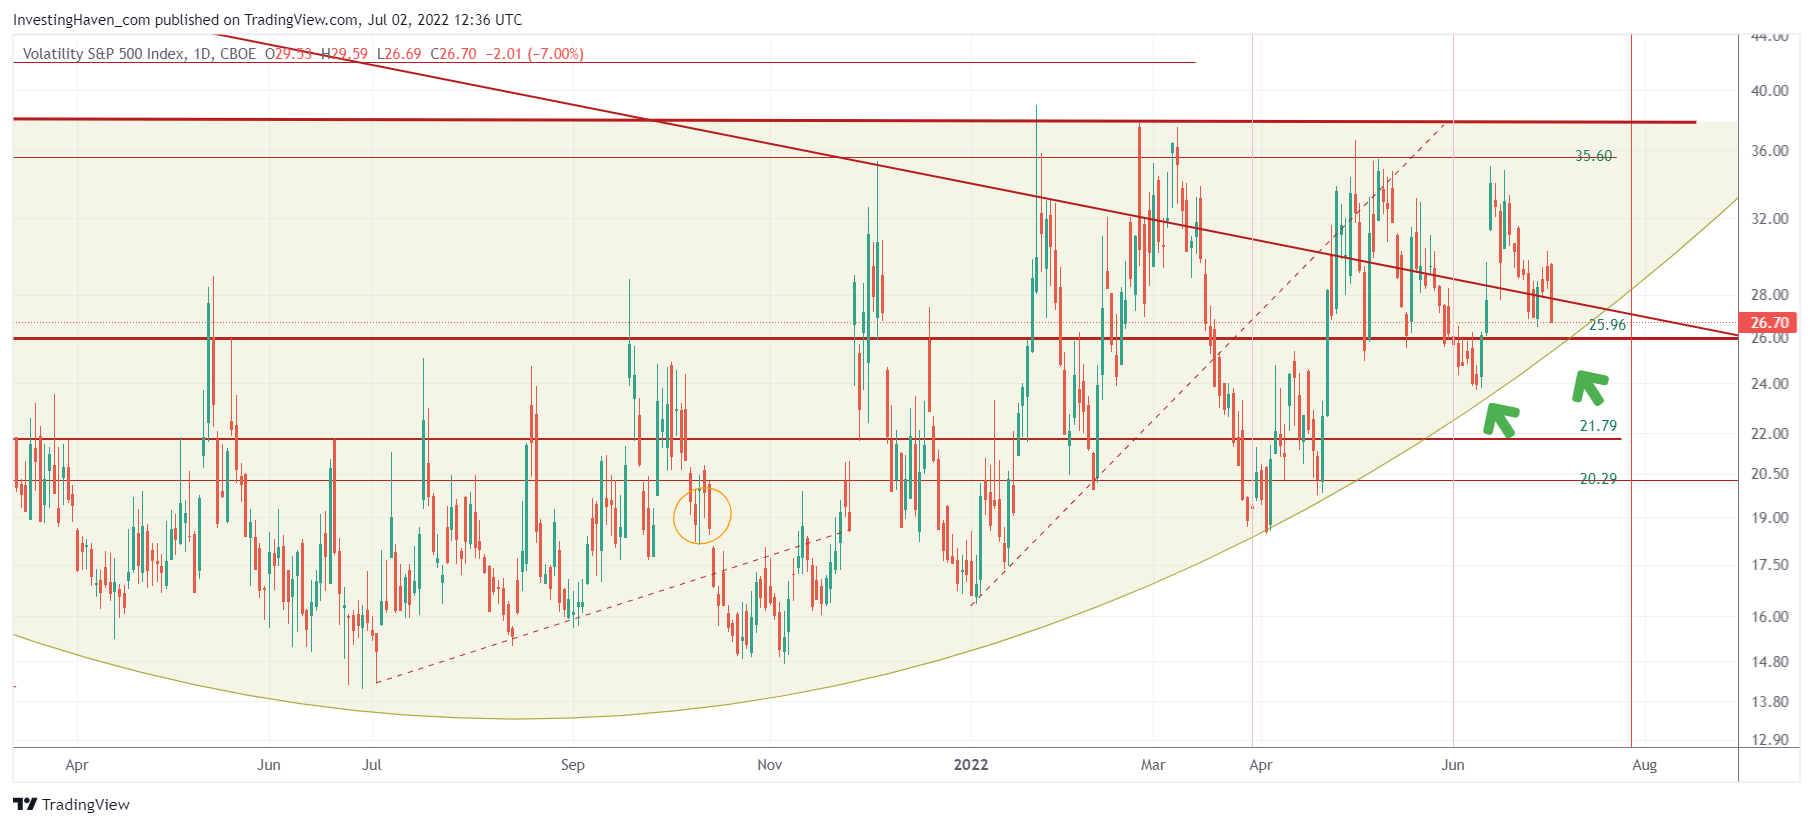
Volatility index #4. VIX is slightly above its rounded pattern. Above 21 points it can create volatility, quickly, so we don’t trust VIX (markets) at current VIX levels of 26. Once VIX trades below this long term rounded pattern, we will be convinced that the recent bearish cycle came to an end.
Volatility index #5. VIX of VIX started a huge breakdown, attempt #2 to break down. This is very promising!
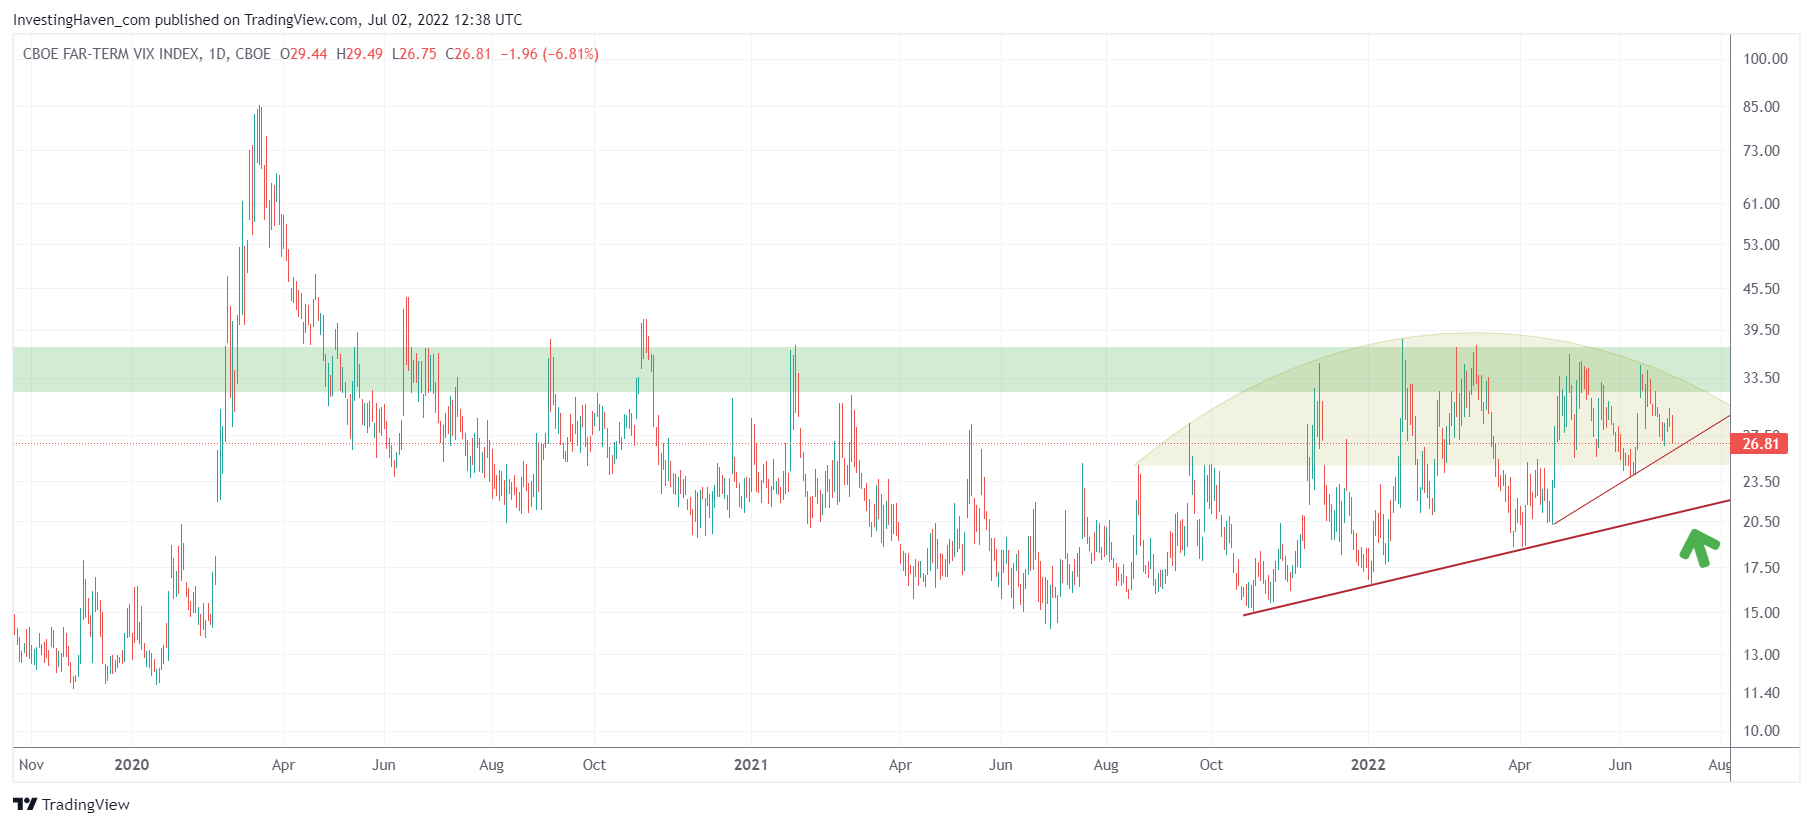
Volatility index #6. Far term VIX has good news for investors. It is very close to a first breakdown level. The real breakdown comes once the lower trendline is broken to the downside (green arrow). The topping pattern is clear and requires a tiny move lower to be confirmed. Moreover, the profile of this chart is turning from bullish (a series of bullish reversals since July of last year) to bearish reversals in recent months.
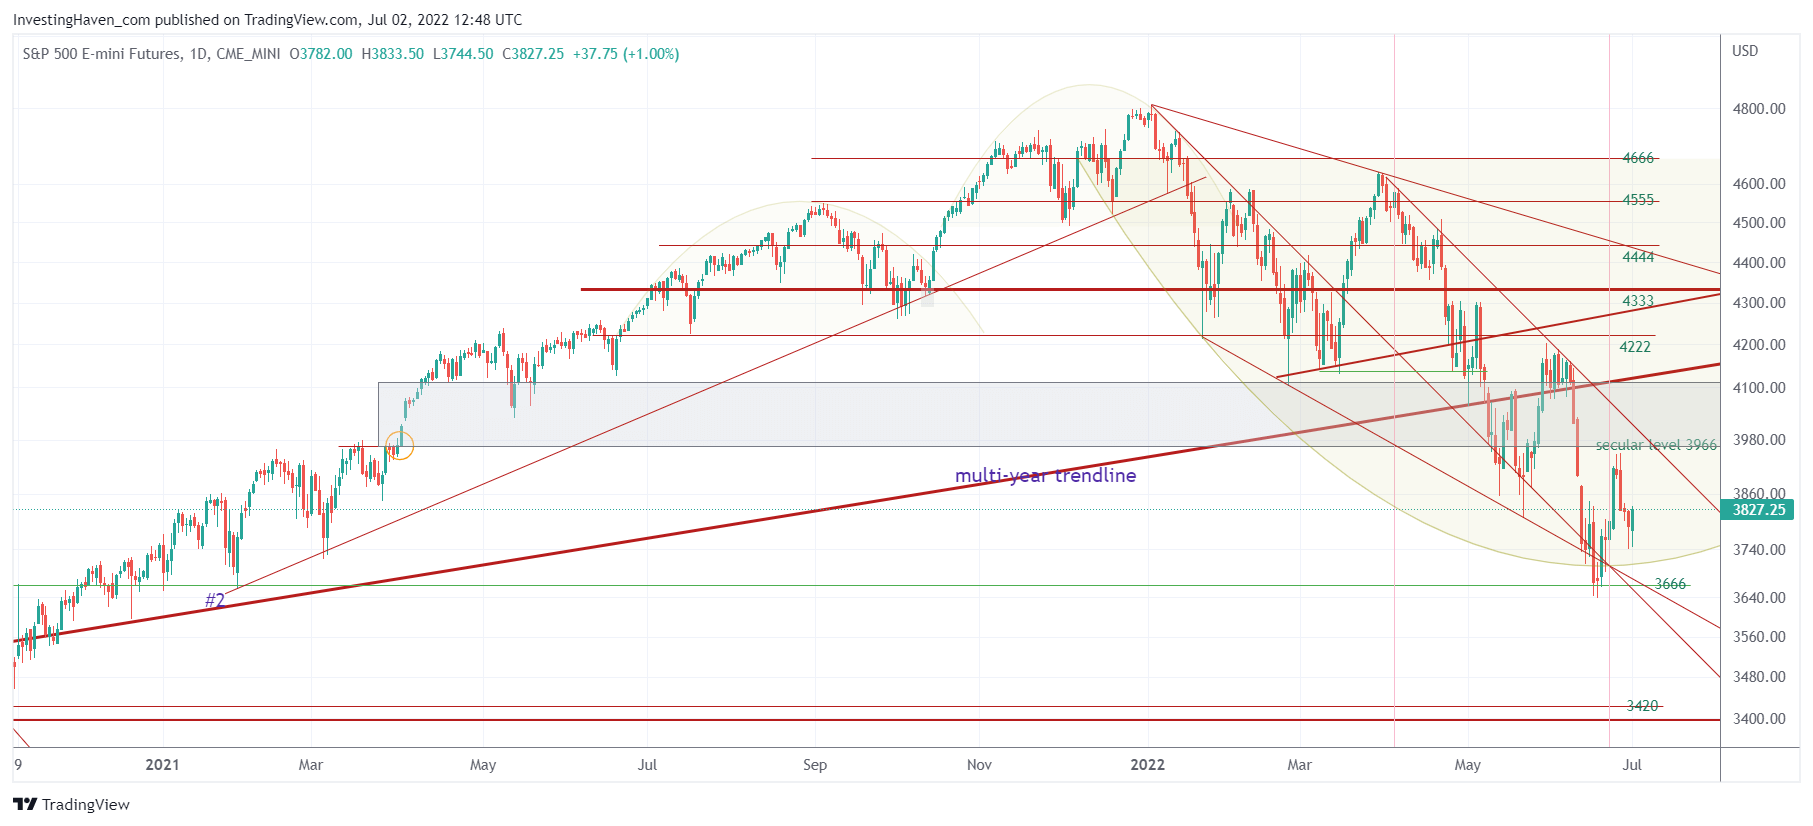
When it comes to the S&P 500 our viewpoint remains the same: the turning point was printed in June 16th, 2022 (16.6.22) when SPX closed at 3666.
Here is more evidence of a turning point:
- In 2022: the bearish cycle took 166 calendar to move down 1110 points from 4784 (highest closing price) to 3666 (lowest closing price).
- In 2020: SPX moved down 1119 points from 3369 (highest closing price) to 2250 (lowest closing price).
Yes, the bearish cycle in 2022 is exactly the same as the Corona crash decline, in absolute numbers. Yes, we just completed a Corona crash in June but one that took 166 days while the Corona crash took 32 days to complete. That’s 4x longer. It feels 4x tougher even though the % decline in 2022 was smaller!
There is a lot of harmony in time/price.
Conclusions:
- A tiny push lower in volatility indexes and a tiny push lower in the USD will create a really big bounce in stock indexes.
- The far term volatility index is visibly changing its profile from ultra bullish to increasingly more bearish!
We expect next week to come with a breakdown in the USD, a big breakdown in volatility indexes, the start of a summer rally in markets. Pending validation (or invalidation) by the market. The opposite might happen as well, theoretically, although we believe the probability of that scenario is low.


