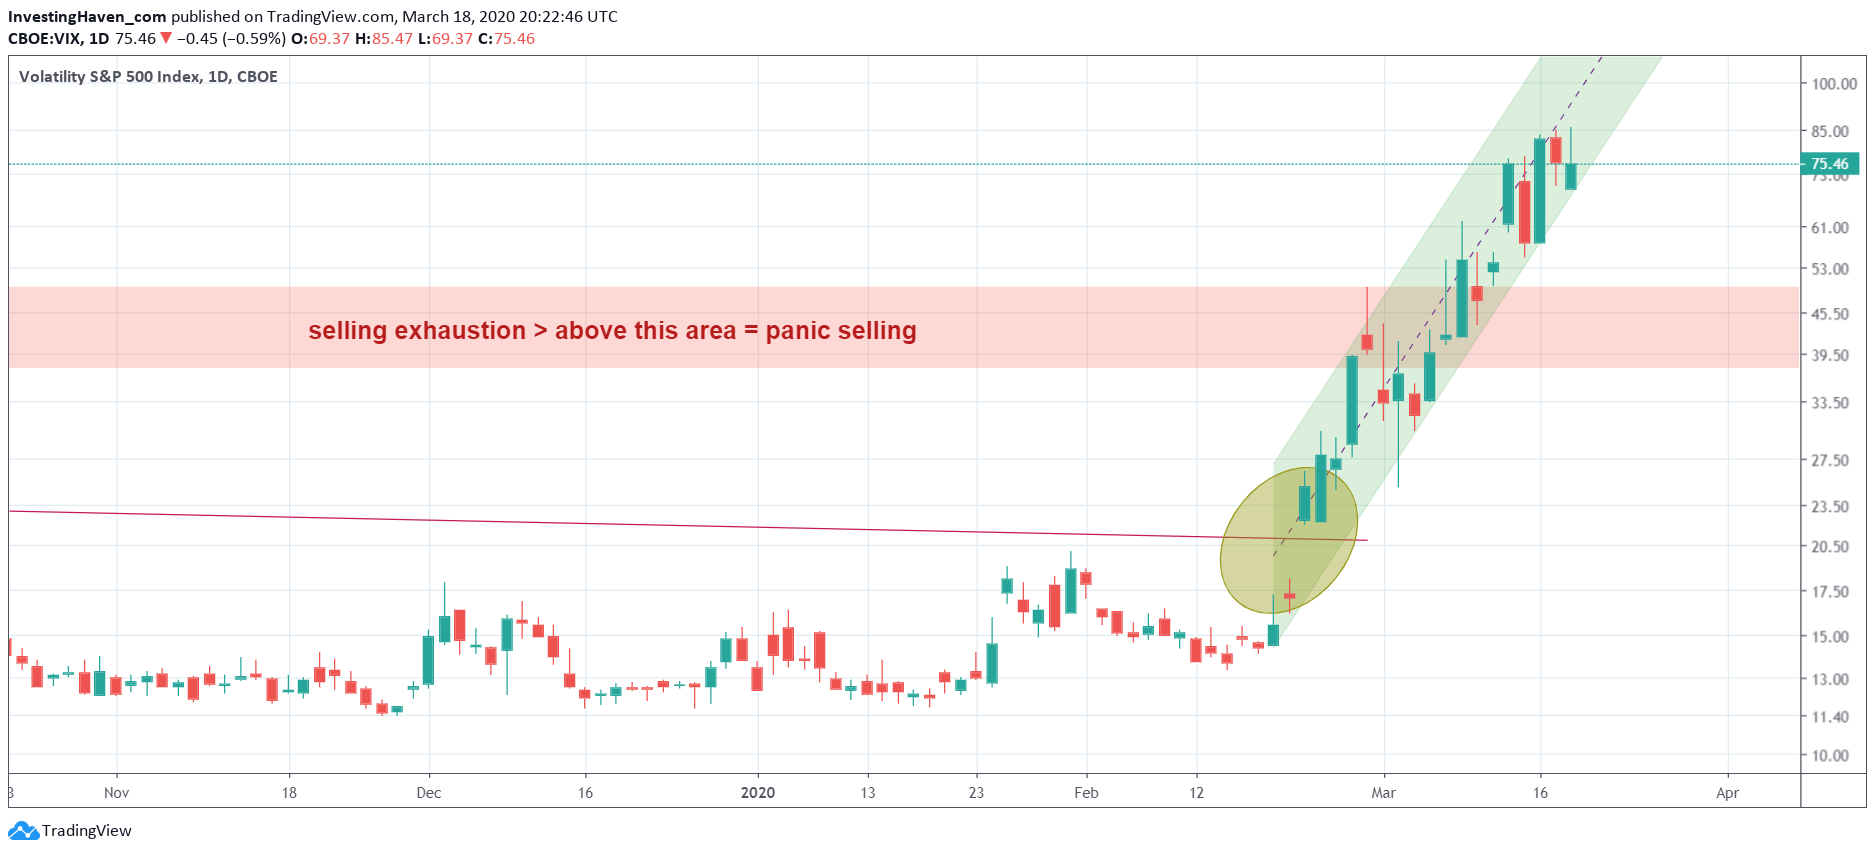
It is really tough to wrap your head around current events in markets. Absolute disorder, is the only way to describe what is happening. We did expect one or two sell offs in the order of more than 7 pct. We got Black Thursday, followed by Black Monday this week. But today another 10 pct drop, which eventually got back to ‘only’ 5 pct at the close, is absolutely crazy. The VIX and TVIX charts are important charts as per our Momentum Investing methodology.
First the VIX as the indicator for volatility is in a strong uptrend for 4 consecutive weeks now. It is also spending more than 2 consecutive weeks above 50 points.
Just to put this into perspective: above 50 points is armaggedon time. In the last 15 years, including the historic 2008 global financial crisis, this happened only once which was obviously in 2008.
In no way is selling in global markets going to fade as long as VIX stays above 50!
Is this a topping pattern in the making? It might be, not sure but if VIX falls below 70 for 3 consecutive days there will be a lot of relief!

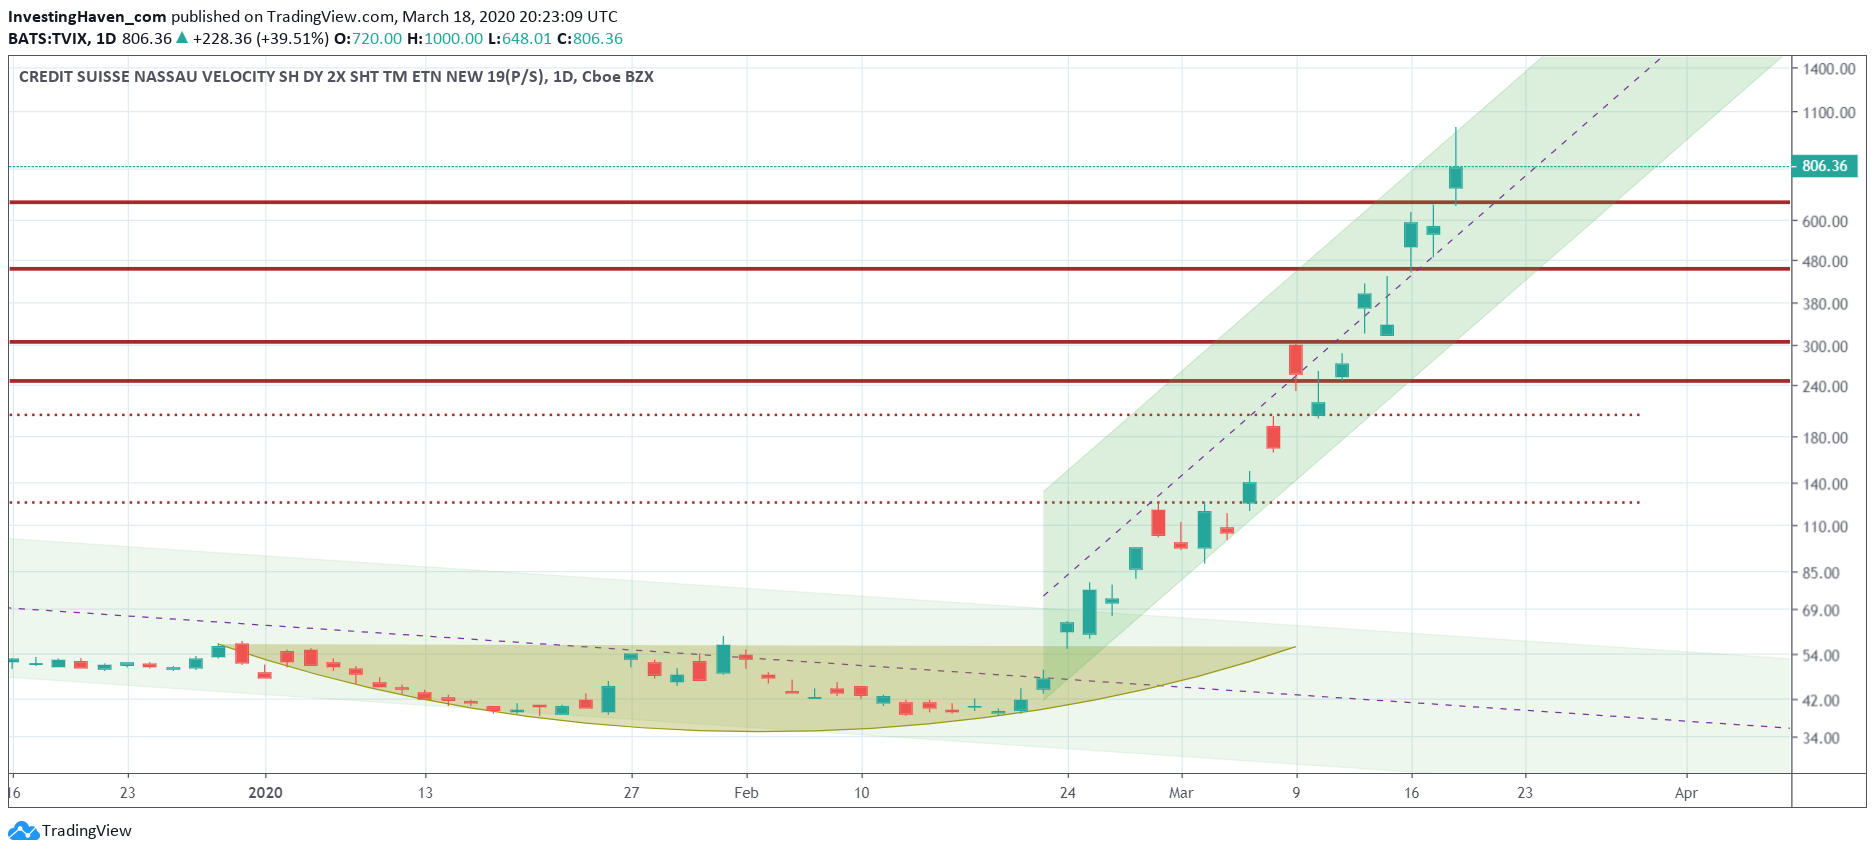
Second, TVIX is the crash instrument for advanced traders. We are not interested in trading this vehicle, but we use this as some sort of indicator.
As seen below there was a parabolic rise in the last 7 trading days. We see a potential major on its chart. Whether this will relax or not is unclear, and the current chart setup is not going to signal anything like this. However, the current rise is most likely not sustainable, is how we would read this chart.

Anything is possible in current market conditions. Markets fell between 32 and 42 pct in the last 6 weeks, so why not another 10 to 20 pct? This is a time to stay safe, physically as well as financially. So protection comes first.


