Since a few months, we have been forecasting an end-of-year rally. We also added that sector rotation would make it not feel like a rally as many stocks and sectors could not benefit from the rally, even though impossible to forecast which sectors would and wouldn’t benefit from it. The point is this: an end-of-year rally would put markets in a better position for the first half of 2024.
We’ll review in this article the data points we used, many weeks and months ago, to forecast the end-of-year rally. We will enrich these data points with the ‘latest and greatest’ insights which confirm that the end-of-year rally will be sustainable.
Data Points Which Supported our End-of-Year Rally Forecast
We asked ourselves the question: will inflation continue to push markets lower in November 2023? This was our answer: “No, inflation will moderate, with a significant decline expected in October’s headline inflation data, providing support to markets in November of 2023.”
Many months ago, we addressed the question if we expect an end-of-year rally In 2023? The answer we defined, back in August: “We anticipate a year-end market surge in 2023. Timeline analysis suggests an end-of-year rally is likely, but the market first has to resolve short-term uncertainties.”
Very recently, we got sufficient confirmation in the data set we track to believe that th year-end rally 2023 officially kicked off:
Interestingly, the charts we shared in recent months showed the start of a bullish time window to start on November 1st, 2023. It happened exactly as forecasted – the lows of the recent volatility window was printed a few days before Nov 1st, 2023.
We added:
There is sufficient evidence that the year-end rally 2023 has started. Our leading indicators are confirming this: VVIX found resistance at 114 points, 2-Year Yields found resistance right above 5%, our timeline analysis suggested that November 1st would mark the start of a bullish window.
Moreover, from completely different angle, from a timeline & cycle perspective, we forecasted a bullish stock market forecast for November 2023. More specifically, on October 15th, 2023, we wrote: “The good news for investors is that a green vertical line is visible on our chart, due early November. This means that a bullish time window is upon is.”
Surprise Headline Inflation Underway
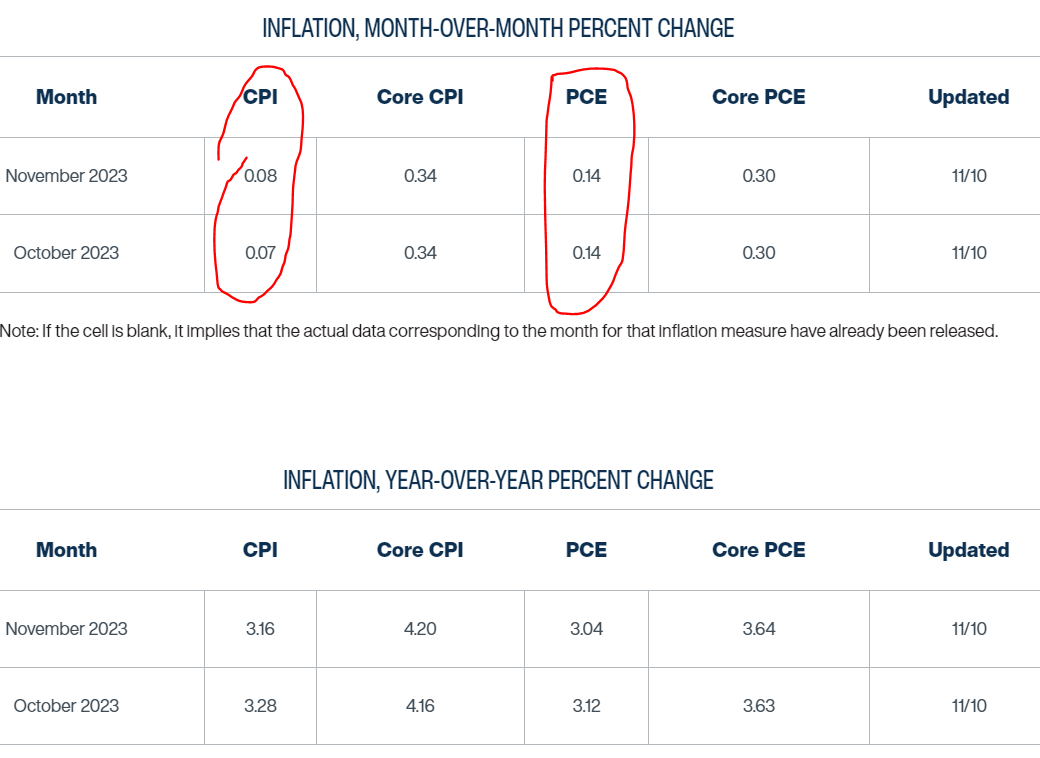
As we head into the first October inflation headline, particularly CPI headline numbers to be released on October 14th, 2023, we see the following (from Bespoke Invest):
The average price of a gallon of gas, according to AAA, was down over 9% in October. In the 14 other months since 2005 that saw gas prices decline 9%+, headline CPI during the comparable month declined an average of 0.4% with negative readings 12 times. The current consensus economist estimate for October CPI (due out next Tuesday) is for a month-over-month increase of 0.1%. If history is a guide, that could be too lofty of an estimate and we could be in store for a negative headline print.
Cleveland Fed’s Inflation Nowcasting estimates a headline CPI that is surprisingly close to zero. This is not just disinflation, it’s almost deflation. Interestingly, this is happening without a move higher in the USD. In other words, good news for stocks should be underway.
Bearish Sentiment: Contrarian Fuel To The End-of-Year Rally 2023
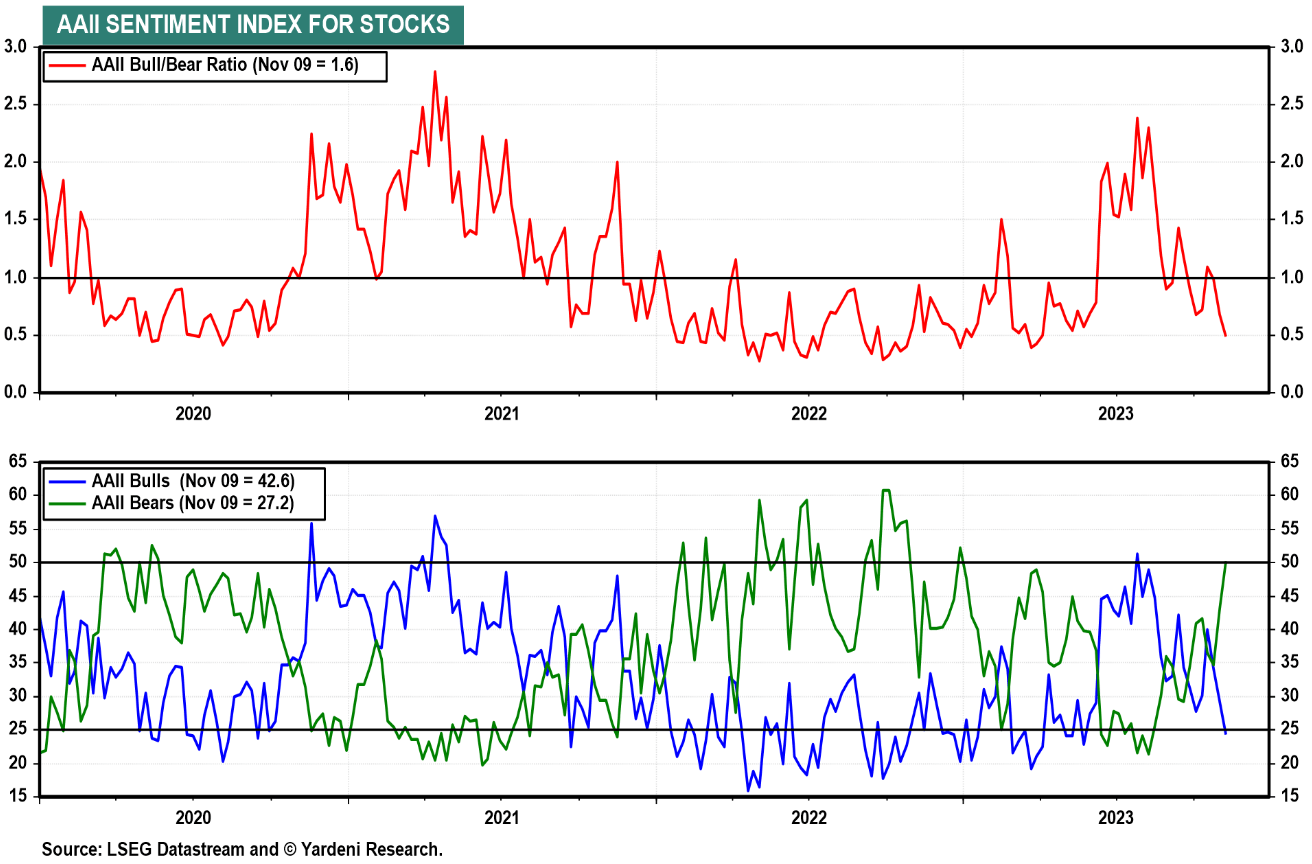
In the meantime, bearish sentiment is near extremes (lower part of the next chart). The bull/bear ratio dropped to levels not seen since October of 2022 (upper part of the next chart).
From a contrarian perspective, this is great news, especially with soft inflation data underway in a bullish time period. This bodes well for the stock market, some sectors will benefit from this in the short, some will benefit from it a later point in time.
In our Momentum Investing alerts, we are focused on the end-of-year effect combined with the hidden 6-month cycle effects. Moreover, we cover more details about a potential 10-bagger (not short term, but by 2026).


