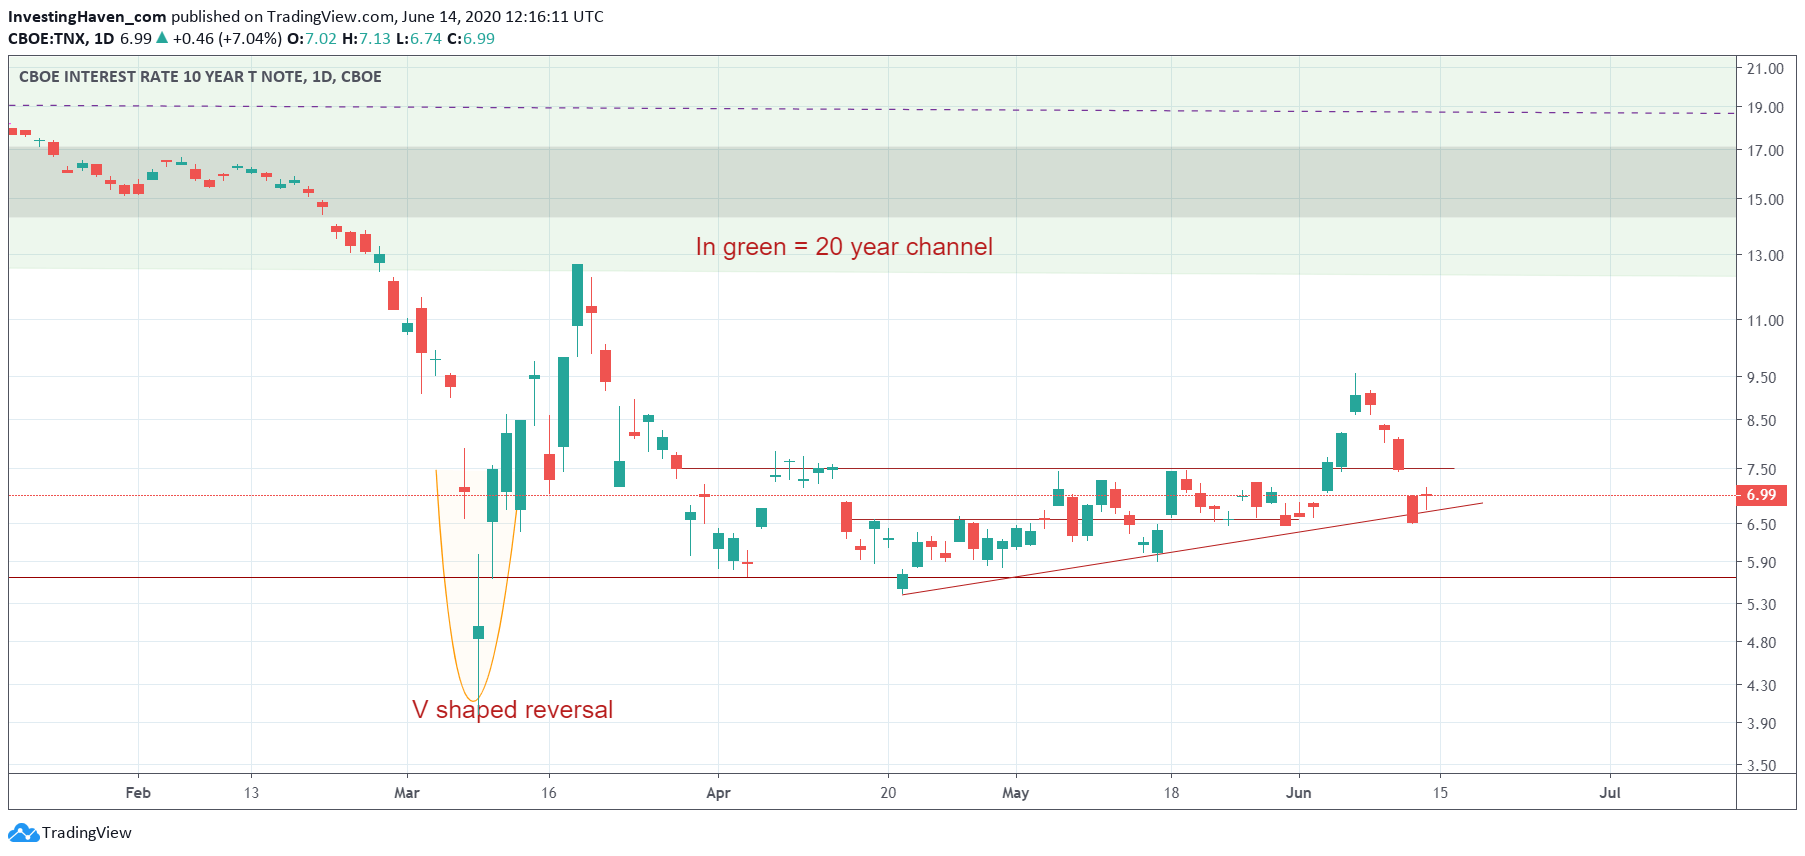
It was a rough week in markets, after a solid stock market rally the week before. The Fed spoke, and market trends broke, first and foremost interest rates. If anything, we do know that interest rates are a leading indicator for (global) markets. As said in our 100 Investing Tips For Long Term Investors we better take large moves in currency and credit markets very seriously.
Interest rates were moving up nicely, and they visibly had the intention to continue rising for a few weeks.
However, the U.S. Fed broken this trend. And with this we can be pretty sure that financial stocks are not the place to be in the foreseeable future. But, more importantly, whatever rates do going forward may strongly impact all markets globally.
For now we see a continuation of the consolidation that started in April, as seen on the daily chart.

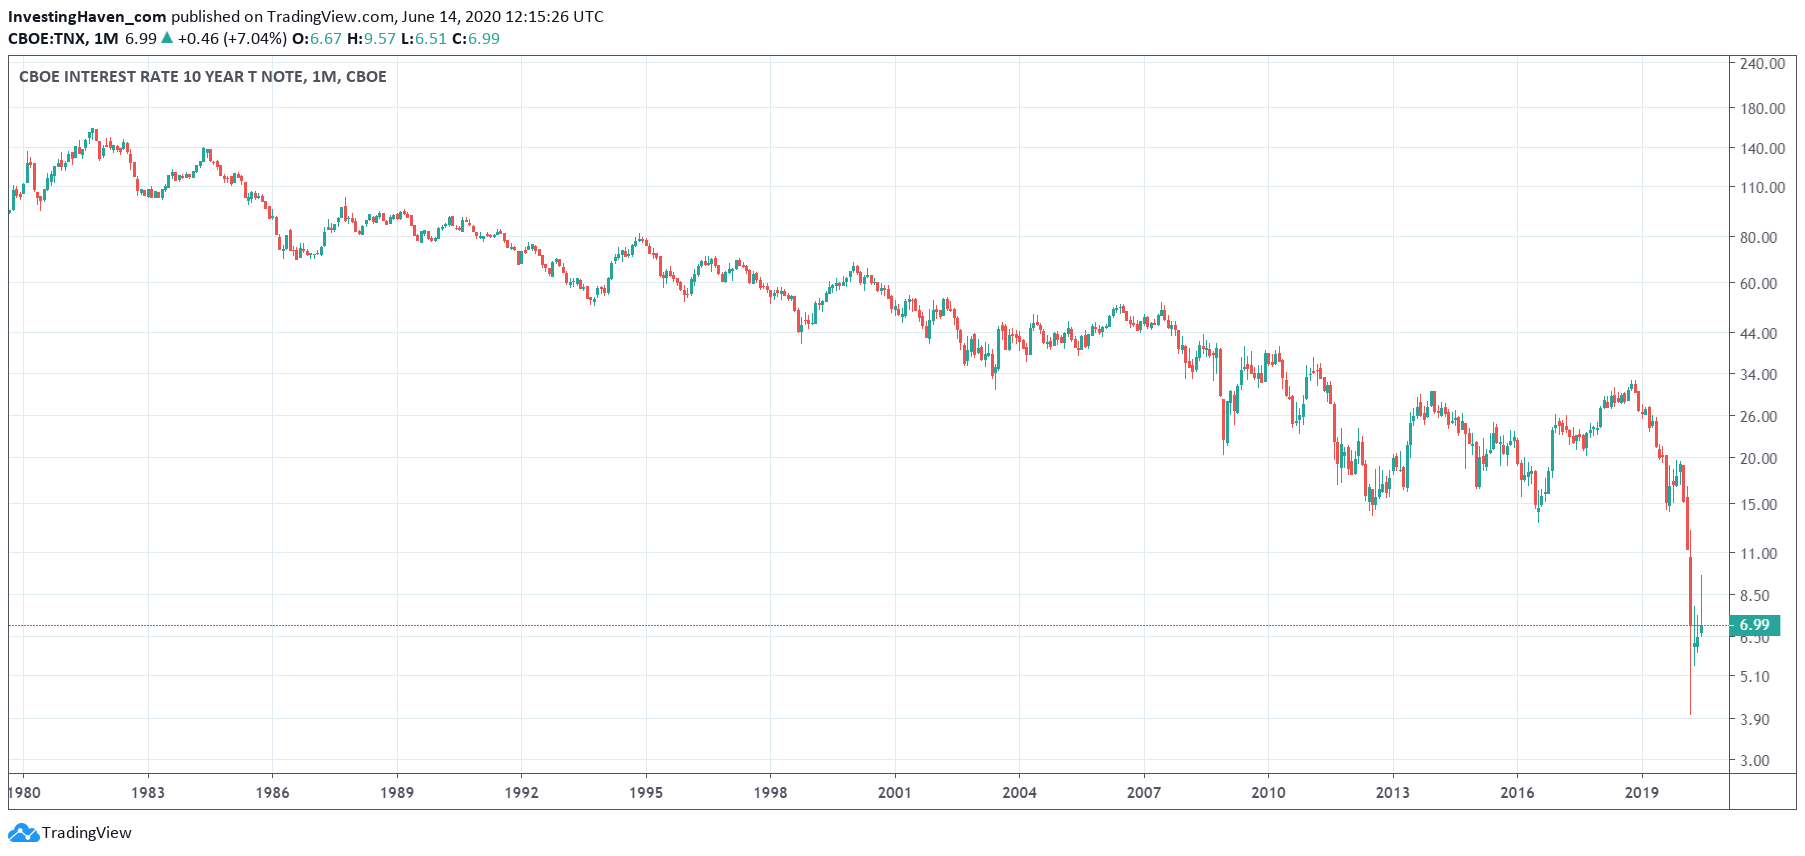
But the very long term chart of 10 year rates is probably the more impressive one.
Look how extreme the recent drop was. 10 year rates fell from 16% in 1982 to 0.39% in March of 2020, only to ‘rebound’ to 0.69% on Friday.
Whether the March drop is the final drop or the continuation of what seems to be a never-ending decline in rates is too early to tell. We are looking at highly unusual circumstances here.
One thing is clear, and probably that’s the underlying message of below long term chart: we are living in special times, and it’s better to adjust investing and trading styles to reflect this.
In our Momentum Investing methodology we refined our approach this week. Our investing strategy remains intact, but we add a layer on top of this: a very precise approach to spot entry points for our investments. When we say precise, we really mean ultra precise. Current market conditions require investors to think as investors, but execute their investments like traders. This new (ab)normal in markets require investors to be sharper than ever before, and this is not going to change before 2021. We did our homework, you can follow our work.


