Many individual investors are afraid, they are scared to death. The market in 2022 has been so uncertain and created so much damage in individual names, it was so hard to predict, that it felt overwhelming. Consequently, the dominant thought currently is that a stock market crash in 2023 is underway. Below are a few data points that show how anxious investors are. At the same time, from a contrarian perspective, these data points might predict that the market is attractive for long term stock market positions.
At InvestingHaven, we said that The Market Will Not Move 50% Lower Contrary To What The Gurus Are Telling. The data points below support this thesis, we find continuous evidence of our investing thesis that the market will not crash, on the contrary.
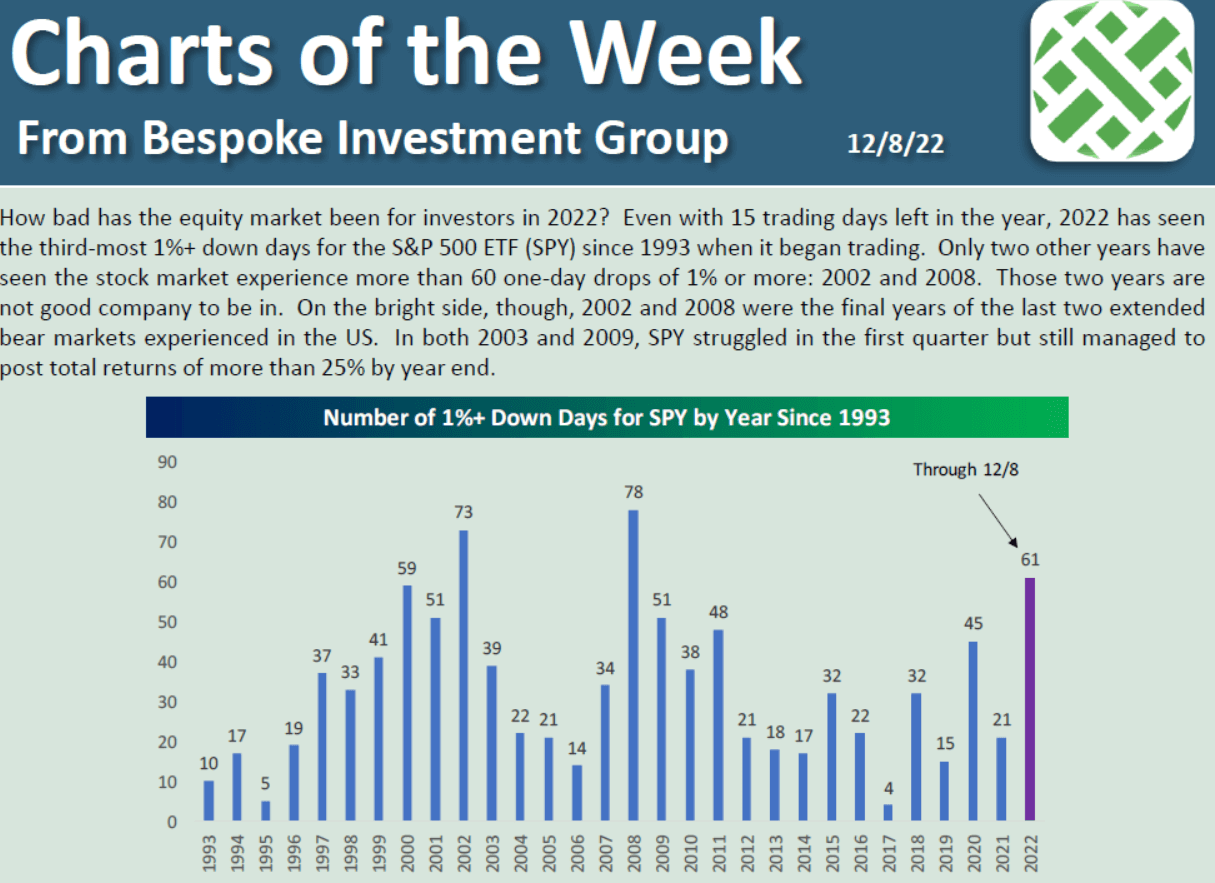
The reason for this fear is uncertainty but also the number of significant drops. As seen on the first chart, from Bespoke Investment, the number of single day drops of more than 1% is 61, so far, in 2022. Only in 2002 and 2008 did the market print more such drops.
The contrarian thesis: the years that followed those two extreme years came with considerable less such drops.
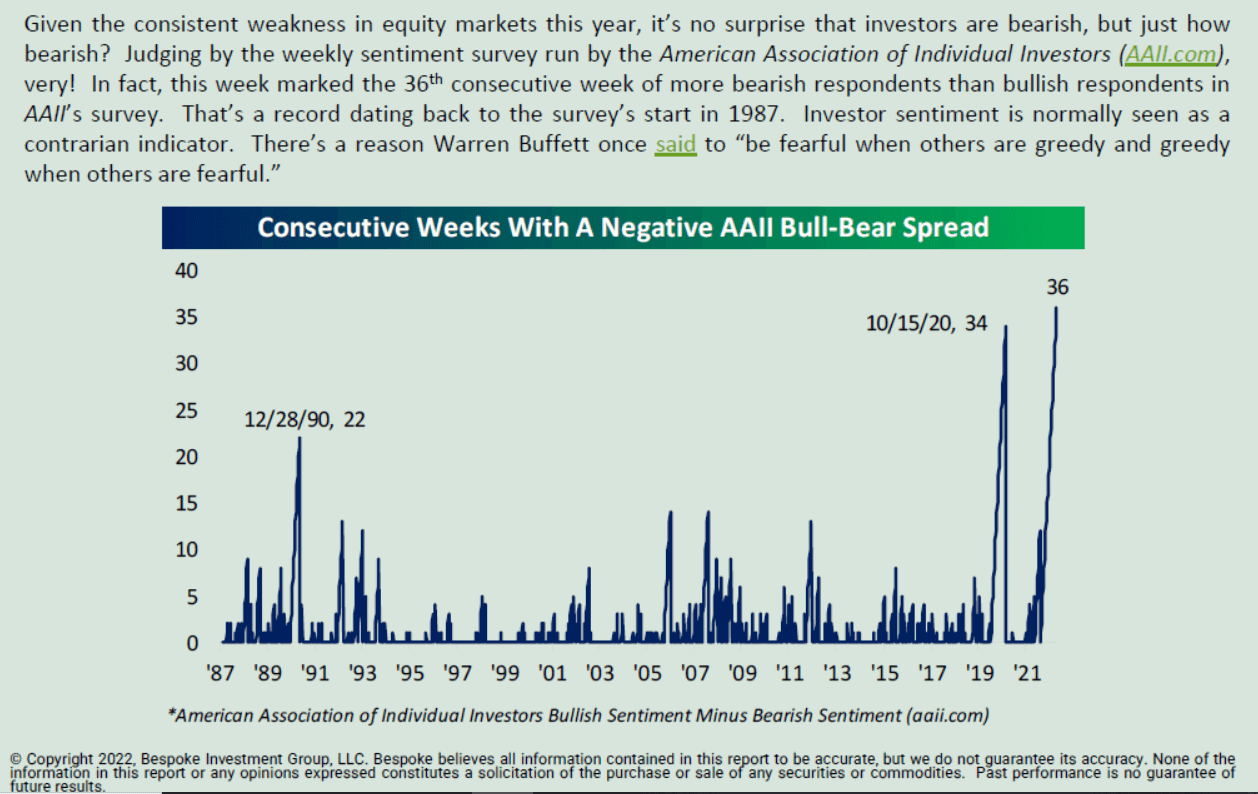
Here is the reaction of individual investors: the number of consecutive weeks in which the number of bearish individual investors outweigh the number of bullish investors reached an all time high. Think about it. Also, try to understand WHY this is the case. Here is our thinking: portfolios have been slaughtered, investors have made terrible mistakes in terms of entries and exits (maybe perceived mistakes, impossible to know exactly), fortunes are lost.
The contrarian thesis: when blood is on the streets…
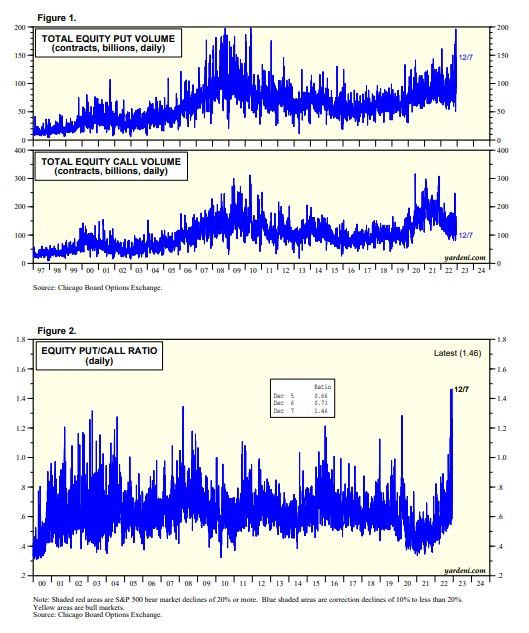
It’s not just sentiment. It’s also the options activity that is extreme. Investors are afraid AND are positioning accordingly. The put/call ratio is historically high, in favor of put options activity. Chart courtesy of Yardeni Research.
The contrarian thesis: what happens to the market if and when these put options are closed? The short covering will be massive! The only question is WHEN in our humble opinion.
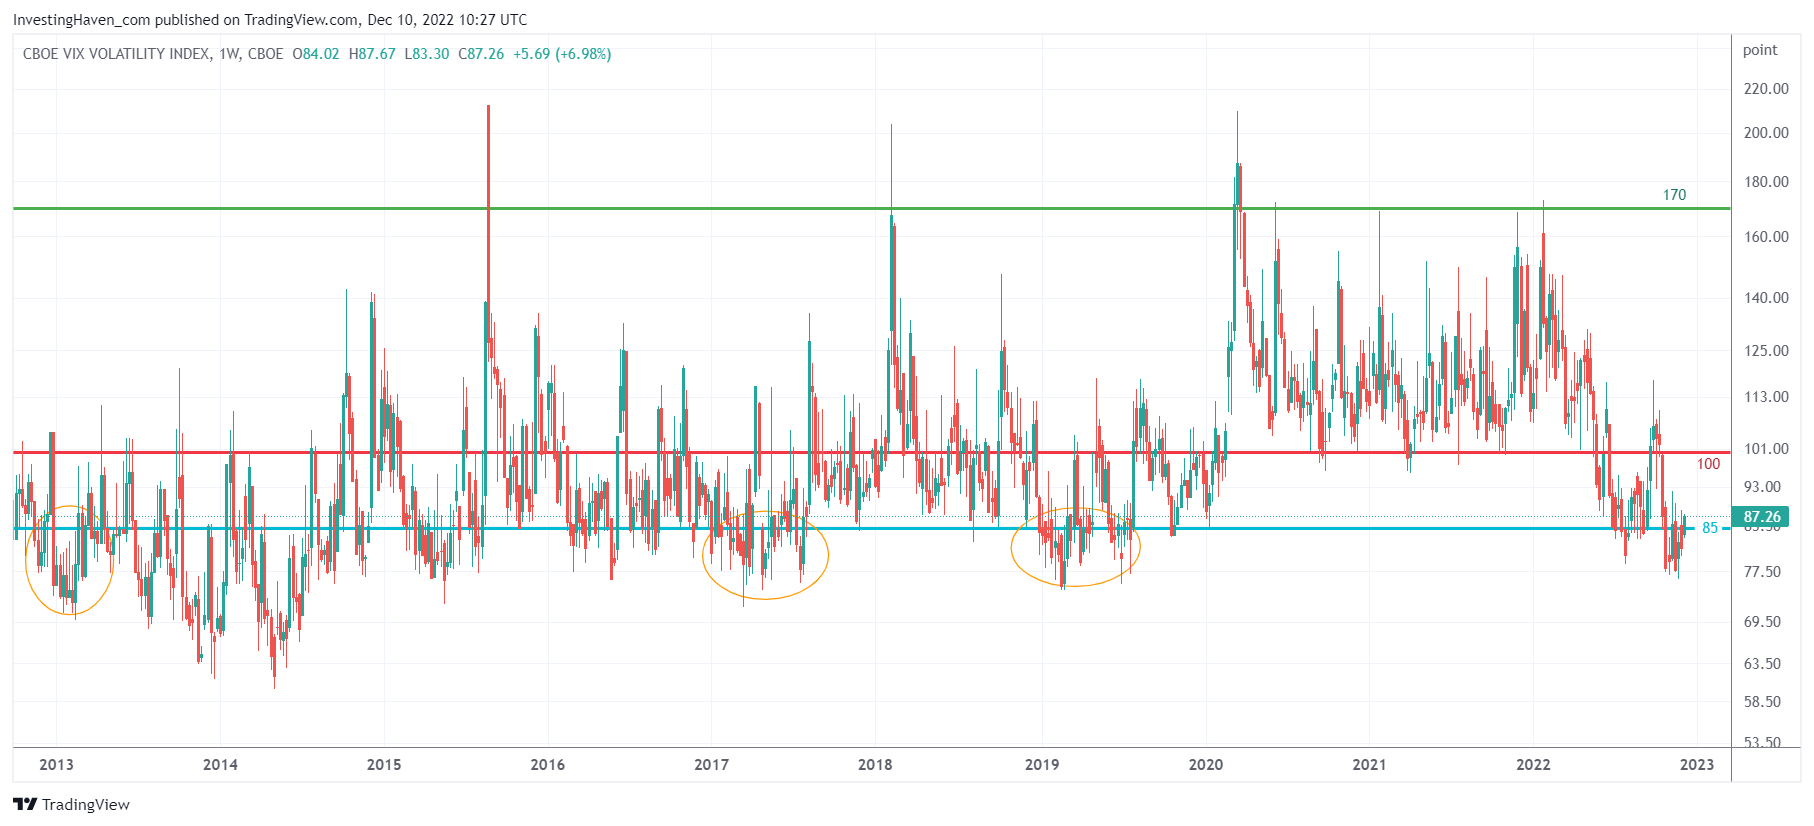
We’ll add one more relevant data point to the mix: VIX of VIX, on the long term.
Below is the weekly VIX of VIX chart. Think of it as the expected volatility level for VIX. We have to read this indicator in a very different way as regular volatility index chart like VIX. This is the commentary from our research:
The median value of this indicator is 85 points. What’s really interesting is to track the periods in which VIX of VIX traded below 85 points. Every time this indicator spent several months below 85 points it coincided with a bullish trend in stock market. Interestingly, by looking at the yellow circles, we see how VIX of VIX spent several months below 85 points right at the start of the following years: 2013, 2017, 2019. Right now, there is an attempt to stay around or below 85 points.
We need more time to consider VIX of VIX as a confirmation that 2023 will be bullish for markets, but the early signs are there.
All things considered, we believe that the market is ready for a bigger move early 2023. The surprise will be to the upside, the power of short covering will be insane is what we are thinking. Short term, anything can happen, larger drops can happen. But a 50% crash? Don’t think so!
