Italy’s political crisis scares investors who are too focused on fear mongering headlines. But is there any hard evidence of Italy’s political crisis causing a stock market crash? Or any other market crash? As usual, the answer is simple: stay focused on the charts, as that’s where the real evidence lies. Charts reflects buy and sell decisions, and that’s what investors should follow.
CNBC says that “Italy scares markets and Europe, again, with new calls to leave the euro.” The word “again” obviously makes a big difference in this headline. These are the highlights:
- Italy’s government is already in the market spotlight with investors awaiting details of its 2019 spending plans.
- The government said last Thursday that it will deliver key populist measures that it promised in the run-up to the election, policies that are expected to increase next year’s deficit to 2.4 percent of GDP.
Reuters writes that “Stocks turn tail as Italy angst grips Europe”. This is how their article starts: “Stocks fell worldwide and European assets sold off on Tuesday after anti-euro comments from an Italian lawmaker dented the single currency and sent Italy’s bond yields to multi-year highs, despite attempts by the government to backtrack. A boost to investors’ risk appetite from the new U.S.-Mexico-Canada trade pact proved short-lived with the MSCI world equity index falling back 0.3 percent.”
What about Bloomberg’s “A Greek Tragedy Made in Italy?: European Equity Pre-Market“. This is how it starts: “Italian stocks will keep the center stage after European finance ministers gave a frosty reception to the country’s new budget and the country’s bonds closed the day at their weakest level in more than four years, with the European Commission warning of a Greek-style crisis.”
Italy starting a stock market crash?
Scary headlines are not the same as a market trend. Stated differently, it is the market itself that is important, and the way to look what the market is really doing is reflected on charts of leading indicators.
For Europe there are 2 leading indicators: the Euro and the Eurostoxx index.
First, the Euro.
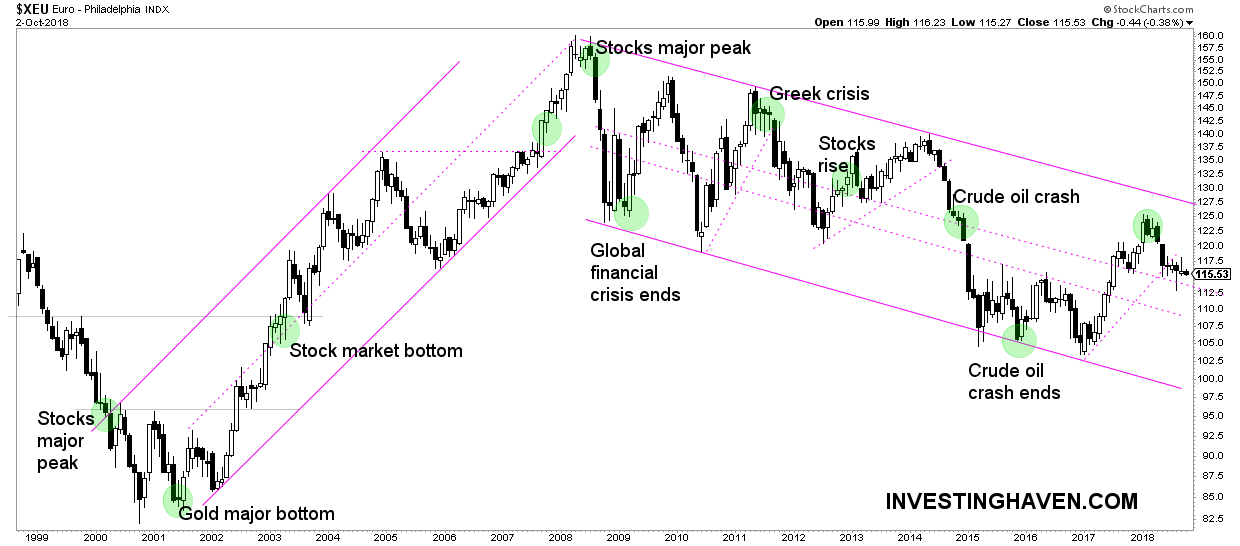
The long term chart of the Euro shows an extremely valuable insight, at least for investors. Every time a major turning point started in markets, the Euro tended to breakdown or test a critical support/resistance level on its long term channels.
All major market turning points in the last 2 decades are indicated with green circles on the Euro chart below.
At this point in time there is no damage done whatsoever on the Euro chart. This does not mean that it cannot happen. We are saying that fear mongering headlines are far more scary than what the real market is doing.
Once 112 points is broken to the downside it may become concerning, for sure if 108 points is broken to the downside.
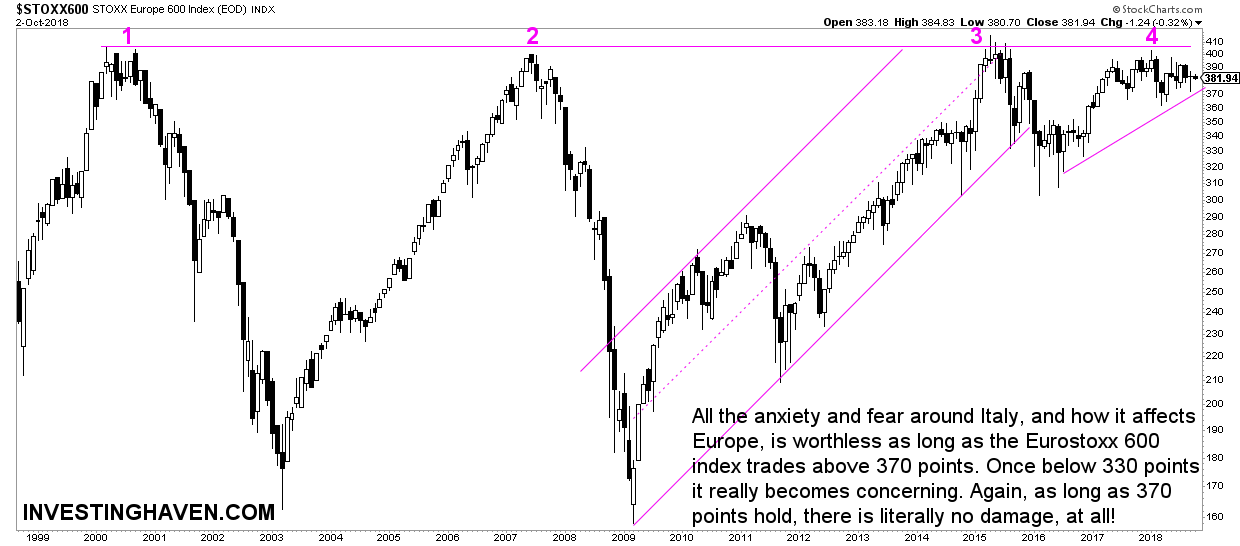
Second, the Eurostoxx stock index.
All the anxiety and fear around Italy, and how it affects Europe, is worthless as long as the Eurostoxx 600 index trades above 370 points. Once below 330 points it really becomes concerning. Again, as long as 370 points hold, there is literally no damage, at all!
Smart investors stay focused on leading indicators, and dominant patterns on their charts.


