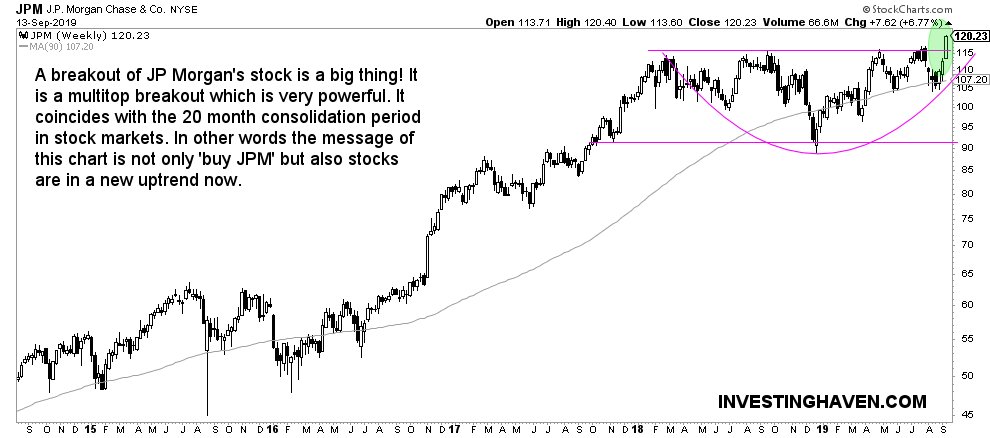
It was only 2 months ago that we wrote about a bullish outcome for JP Morgan (JPM) out of its 20 month consolidation period. This is our article published in July of this year: JP Morgan Preparing An Upside Breakout in August 2019. We missed the breakout with 2 weeks only. It did not happen in August but early September. There are a few messages that this chart has, and we refer to our article Investing Opportunities #8: Top Sectors In 2020 Are Likely Semis, Banks, Uranium, MJ. This is what we read into it!
First, on a macro level, based on a top down approach, we want to remind readers of this quote in the last episode of our Investing Opportunities series:
What’s interesting to observe is the correlation between 10 year rates and stocks, specifically RISK ON stocks. We are talking the Russell 2000 obviously which represents small caps, and is the primary index representing RISK ON.
We believe the first thing to read into JP Morgan’s stock price breakout shown on below chart is exactly the macro level message: RISK ON is here again after 20 months!
The second message, also from the same article, is this:
Banking stocks are driven by rates. Rising rates are great for banking stocks. The below chart suggests that rates have upside potential, in which environment banking stocks will do well. This is an intermarket dynamic driven conclusion.
See, this is the point: it’s all part of one and the same trend.
Investing is about understand the trends, and we know trends tend to change on a 6 to 18 month basis. It’s all related to capital flows.
Clearly, with a crash of rates (the 10-year Treasury Yield lost 60% in value in 10 months) it is clear that this move is overdone. A reversion to the mean is what’s happening now.
From a capital flows perspective it implies capital will flow from Treasuries into stocks, and banking stocks specifically will do well.
The third and last message is the most intuitive one: the stock price of JP Morgan (JPM) will do well going into 2020. We are bullish on JPM.


