In our intermarket analysis we look at the Euro chart, particularly bullish and bearish trends. That’s because they inform (future) trends in risk assets and help us forecast markets, first and foremost stocks and commodities. Our gold forecast and silver predictions are often based on trends on the Euro chart. Especially the long term trend on the Euro chart (monthly timeframe) is important to watch. The monthly Euro chart shows a very interesting pattern at a decisive point.
Intermarket analysis helps us understand where capital flows, directionally.
If the Euro against the USD is doing well, especially after a short or longer term bullish USD trend, it implies investors (in general) move out of cash (USD) to rotate into risk assets.
We discuss the Euro once per month on average. This what we wrote early March of this year:
Leading Global Market Indicator: Secular Breakout Not Successful Yet
In essence, up until February, the Euro was in a tactical uptrend in the context of a secular downtrend.
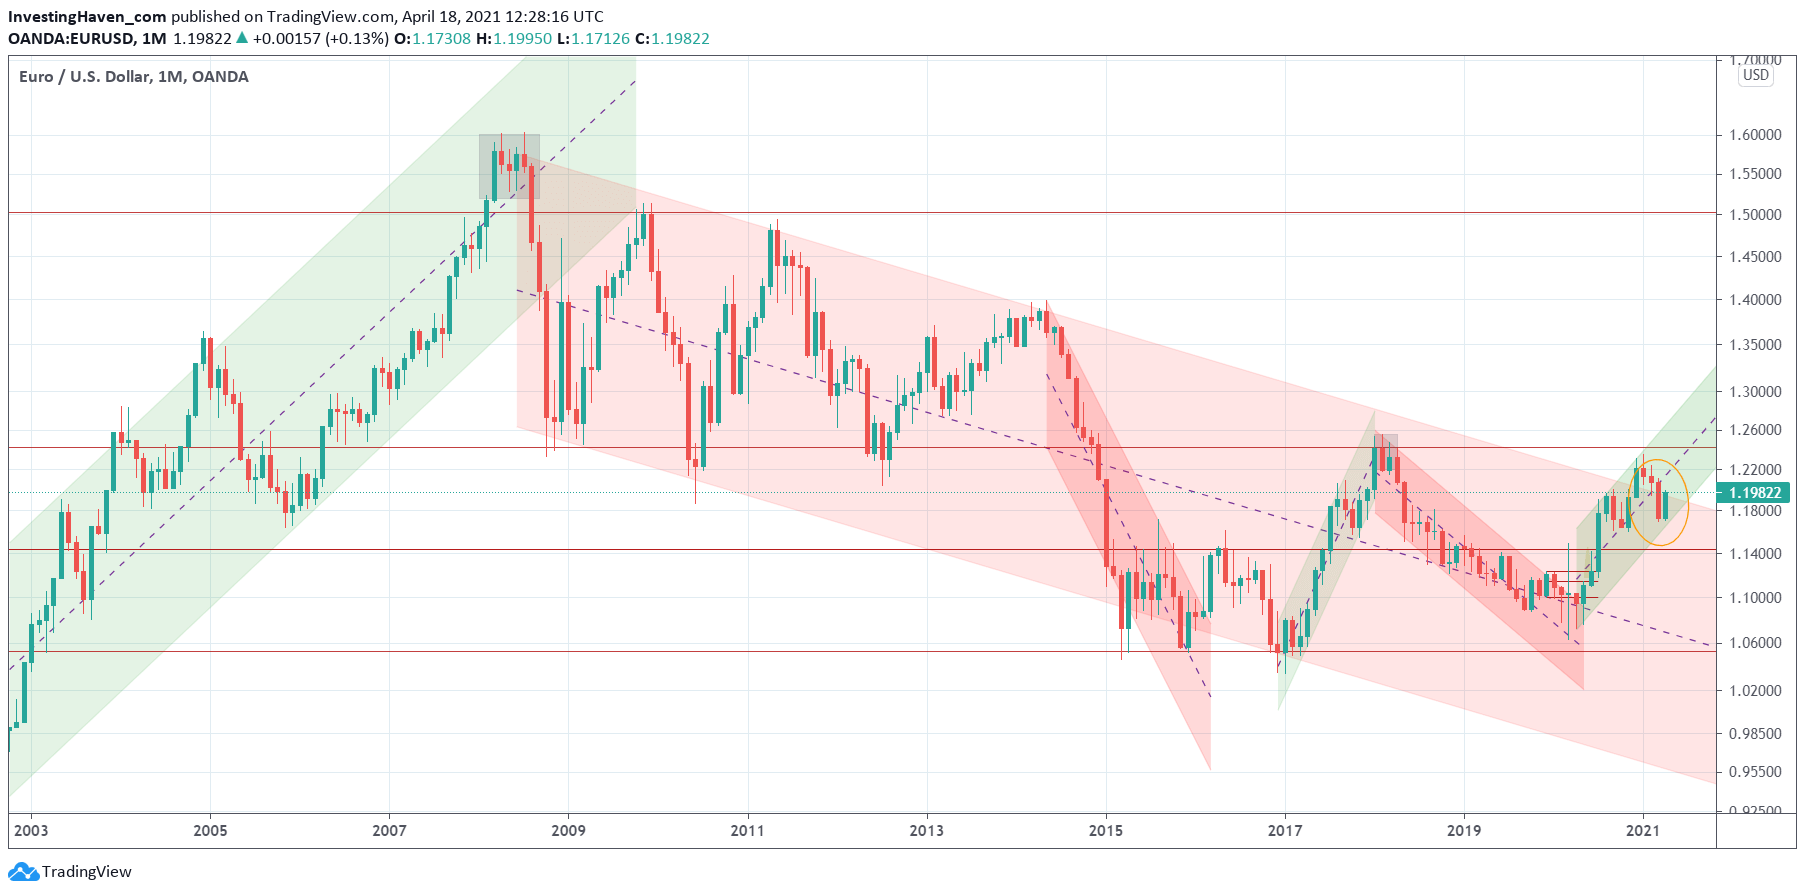
The most interesting finding from the secular Euro chart is that it recently tried to break out from its secular downtrend. However, it didn’t succeed.
A very important insight: the monthly Euro chart was bullish until December. It moved above a secular downtrend in 2020, but got back into its secular downtrend in January/February/March.
March will really be a crucial month. As in, really crucial. That’s because if the Euro sets a solid red candle we might see a topping pattern … in which case the picture would not look really promising. The opposite is true as well: a monthly close (way) above 1.20 would result in a small (or even tiny) red candle which wouldn’t imply a lot of damage was created on the secular chart.
We’ll have to watch the monthly close of the Euro, as it might be decisive for the stock bull market in 2021. A monthly closing price that is close to the open price of March 1st would be great.
Don’t expect such a secular breakout to happen easily. It will require at least 2 attempts.
We followed up on the Euro trend a few weeks ago in this article Decision Time: This Leading Market Indicator Is Testing Secular Risk Levels
After a massive RISK ON breakout in December markets are now ‘testing’ this breakout level. The importance of this is huge. If the Euro trades above 1.19 points on a weekly and monthly open/closing basis it will support RISK ON globally.
We call it ‘secular risk levels’, and the Euro suggests that global markets are in the process of ‘testing’ those risk levels.
We better pay attention to the Euro’s closing price of March, as well as price action in April, for stocks as well as commodities.
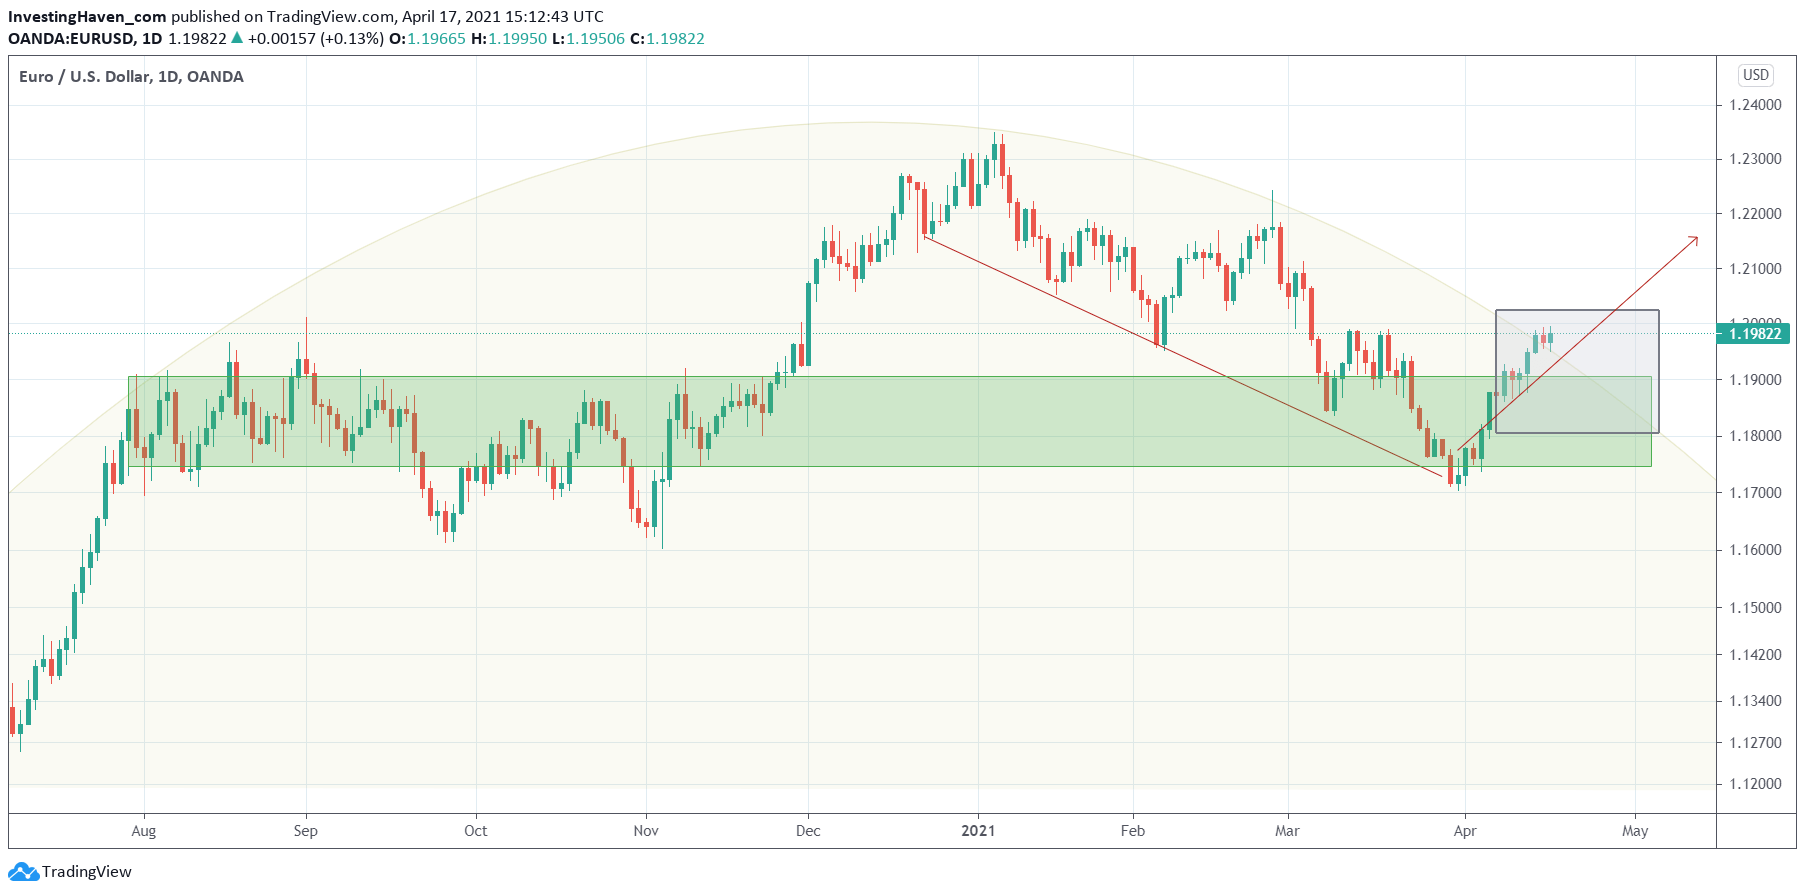
The daily chart has some good information for investors in stocks and commodities: the Euro broke up from its 12 month rounding pattern, and now trades at 1.198 points.
The above chart is very important as it shows a breakup, a bullish event.
But it happens exactly at a time when the monthly chart is trying to get back above the 12 year bear market (large red falling channel). This is huge, really huge.
This month’s closing price of the Euro will be so crucially important, and any reading above 1.20 points will be major new, absolutely big as it will confirm that the stock bull market is set to continue! Moreover, commodities will do well.


