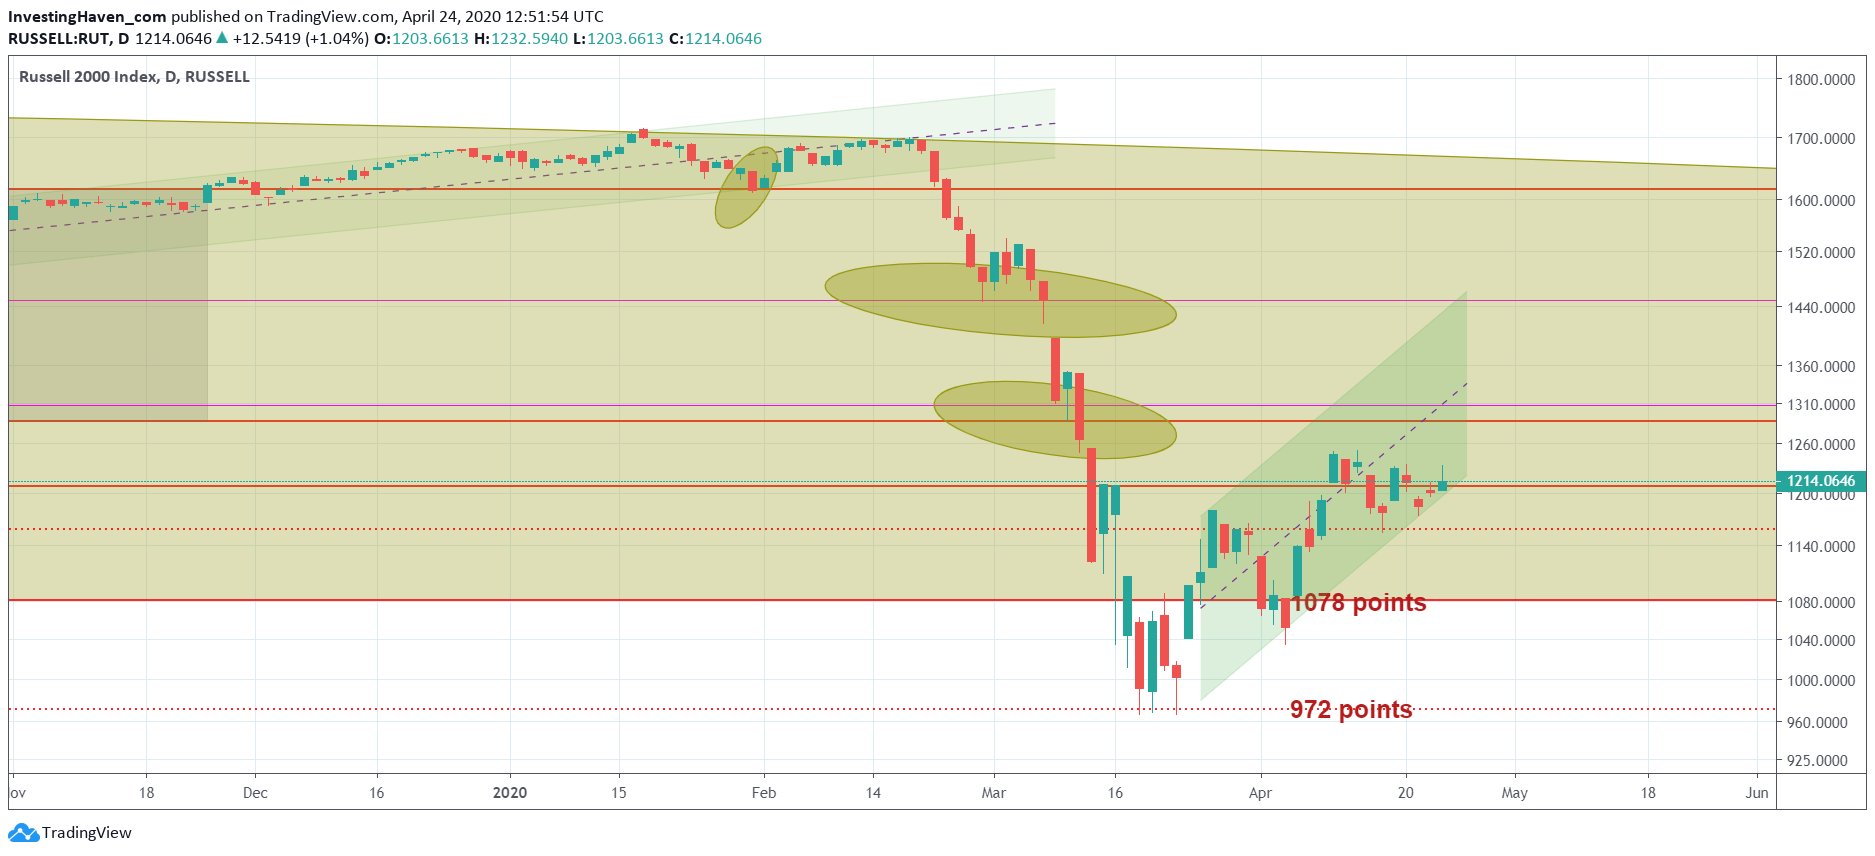
Our followers know by now that we track a handful of leading indicators to forecast markets. We strongly believe in the ‘less is more’ principle: less leading indicators, less confusion, higher quality forecasts, mental balance. This is one of the many implications of our 1/99 Investing Principles. One of our leading indicators for our stock market forecasts is the Russell 2000. We are not interested to trade this index, we are interested to understand its direction. And it has a track record of forecasts (strength of) trends, risk on / risk off cycles, major turning points.
If anything, the Russell 2000 is a great asset to use as a leading indicator. It requires quite some time to understand its ‘DNA’, and as we said often in the past every market / stock / asset has its own ‘personality’ (we call it the DNA). This has to be respected, and that’s why creating a single chart might take many hours, even days, before getting it right.
When it comes to the Russell 2000 we see 2 very important dynamics at play right now.
First, historic market behavior has proven the 1212 level to be very important. If it was important in the past it continues to be important at present day (even more important over time).
Here is a small secret of charting: the longer a price point continues to be tested the higher its importance.
Second, there is a short term rising channel on the chart of the Russell 2000. Last Friday support got successfully tested.
Now we have a double success on the Russell 2000 chart. This suggests that stocks have a bullish bias. It brings hope for stock market investors.
Our premium members receive several times our proprietary crash indicator analysis reports. That’s the analysis from this article, augmented with several other indicators.


