Bitcoin (BTC) up again this week, after a small retracement last week. This seems an accumulation of evidence that our Bitcoin forecast is underway, though it may be 1 or 2 years out. InvestingHaven’s followers who read these 5 cryptocurrency predictions already 9 months ago knew it was a question of ‘when’ (not ‘if’). The secular bull market was about to resume in 2019, and the evidence is now there! It was already there, by the way, when we wrote our update on Bitcoin’s long term chart is bullish.
On April 2nd 2019, Bitcoin broke out of its bear market channel. We officially called the start of the new crypto bull market, and we wrote Blockchain & Crypto Space On Fire.
Note that InvestingHaven followers were among the first ones in the world to get an official market call 6 weeks earlier.
On February 25th, 2019, InvestingHaven’s research team flashed this alert to its members: “Buy alerts everywhere. As forecasted, 2019 is a great year to accumulate extremely undervalued crypto assets!”
One of the sentences in this research report in the form of a crypto alert to its members said: “This alert has the largest number of buy signals we have ever flashed in our blockchain & cryptocurrency investing service since its inception!”
Even in the public domain InvestingHaven’s research team flashed a cryptocurrency alert forecasting that the Crypto Winter Ended.
Bitcoin Chart Analysis Is No Different That Classic Chart Analsyis
As per investing tip #4 from our 50 cryptocurrency investing tips 2019 and 2020 we must remained disciplined and respect all classic analysis techniques also when analyzing cryptocurrencies and associated opportunities.
All investing principles as well as chart analysis techniques apply to cryptocurrency investing. Surprisingly, most if not all cryptocurrencies have clear and concise chart patterns. They serve as the basis for timing the market with great entry and exit points.
The idea is pick the right entry points, and start working on exit points already now. That’s how we guide investors in their crypto investments. It’s the only way to stay focused, and not get emotional about the huge price swings that are about to come, in both directions.
Bitcoin Chart Says “Up and Away”
The Bitcoin chart could not look better!
After a small retracement a week ago it performed this week as expected and in line with our bullish forecast.
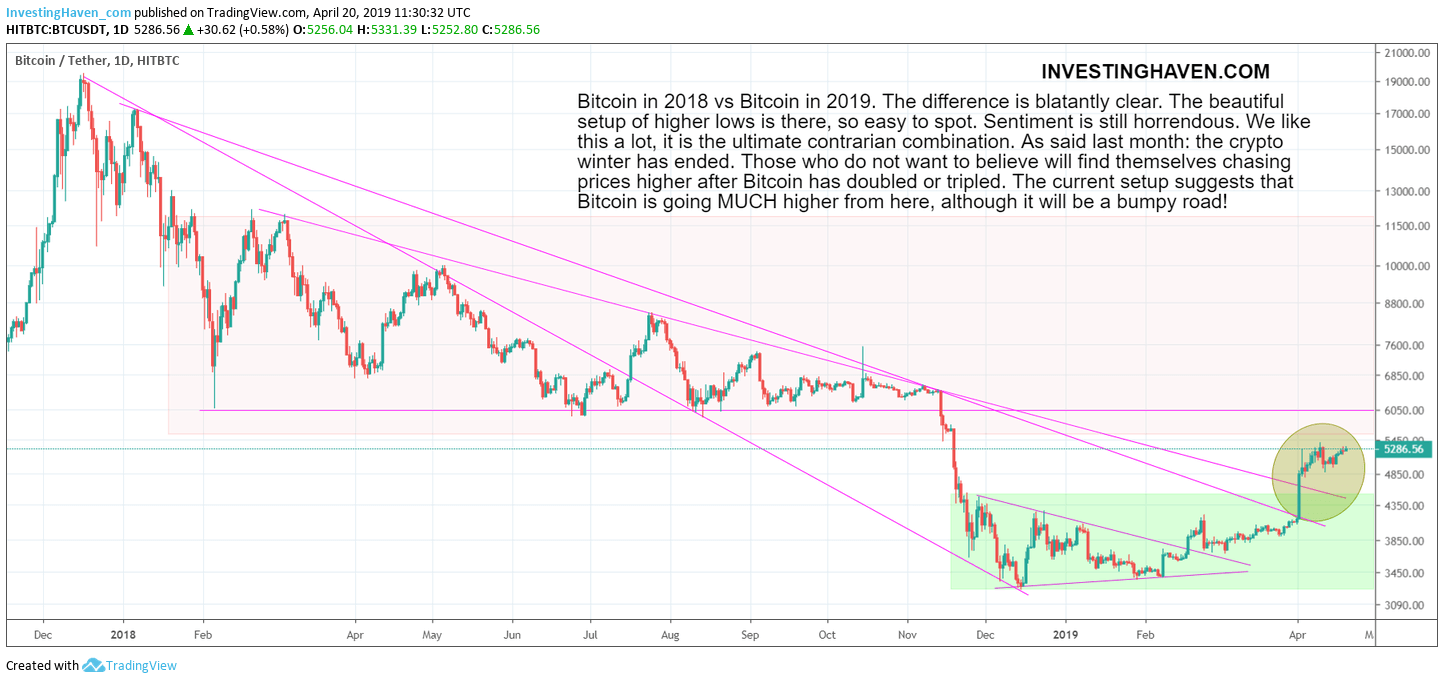
Below is the version with annotations produced by InvestingHaven’s research team. Essentially, it shows all possible relevant trend lines, knowing that Bitcoin’s chart has some complexities to deal with.
What’s the message of this Bitcoin chart?
Anyone who is open to read a chart sees what happened on Bitcoin’s chart in the month of April.
- A GIANT breakout took place on April 2nd, 2019.
- The breakout is confirmed after 18 trading days as it continues to trade ABOVE its bear market trendlines.
- This week’s formation suggests Bitcoin is moving higher (see setup within the annotated circle).
We have to warn readers for a bumpy road. ‘Up and away’ means that we will likely not see current prices again in the future. However, it will not be one straight line in which prices will move up.
Ed. note: How to get the maximum out of crypto and blockchain investing? We invite followers to subscribe to our blockchain & cryptocurrency forecasting service. It contains dozens of detailed charts on cryptocurrencies and blockchain stocks. It continuously analyzes the crypto market and continuously reports back to its users when opportunities arise. Most, if not all, of our crypto recommendations already tripled since flashing the first buy alerts in January/February of this year!


