Investing Haven
No Result
View All Result
Gold Silver Investing >>
CRYPTO INVESTING >>
  • 2025 Forecasts
    • 10 market predictions
    • Dow Jones forecast
    • S&P 500 forecast 2025
    • Nasdaq prediction 2025
    • Best altcoins to buy
    • Best crypto to buy now
    • Which crypto will explode
    • 15 crypto forecasts 2025
    • Which precious metal to buy
  • Silver
    • Silver prediction 2025 – 2030
    • Will silver exceed $30?
    • When will silver hit $50?
    • Can silver hit $100?
    • Silver shortage
    • 50-year silver chart
    • Silver bullish reversal
    • Silver seasonality charts
    • How to invest in silver
  • Gold
    • Gold prediction 2025 – 2030
    • Will gold set new ATH?
    • Will gold hit $3,000?
    • Can gold hit $10,000?
    • Gold chart 10 years
    • Gold chart 50 years
    • Gold chart 100 years
    • Gold silver ratio
    • Gold seasonality charts
  • Commodities
    • Coffee forecasts
    • Sugar forecasts
    • Nickel forecasts
    • Lithium investing
  • Crypto forecasts
    • BTC prediction 2025 – 2030
    • ETH prediction 2025 – 2030
    • SOL prediction 2025 – 2030
    • XRP prediction 2025 – 2030
    • XLM prediction 2025 – 2030
    • BNB prediction 2025 – 2030
    • ADA prediction 2025 – 2030
    • AVAX prediction 2025 – 2030
    • KAS prediction 2025 – 2030
    • NEAR prediction 2025 – 2030
    • BCH prediction 2025 – 2030
    • LINK prediction 2025 – 2030
    • DOT prediction 2025 – 2030
    • SUI prediction 2025 – 2030
    • ICP prediction 2025 – 2030
    • LTC prediction 2025 – 2026
    • STX prediction 2025 – 2030
    • DOGE prediction 2025 – 2030
    • SHIB prediction 2025 – 2030
    • PEPE prediction 2025 – 2030
    • FLOKI prediction 2025 – 2030
    • WIF prediction 2025 – 2030
    • ONDO prediction 2025 – 2030
  • News
    • Crypto news
    • Commodities
  • Login
Investing Haven
No Result
View All Result

20 Year Treasuries: The Most Scary Chart Of 2019

Taki Tsaklanos by Taki Tsaklanos
January 13, 2019
in Markets & Stocks

Home » Markets & Stocks » 20 Year Treasuries: The Most Scary Chart Of 2019

2k
VIEWS
Share on FacebookShare on Twitter

We just finished our brand new section which features how InvestingHaven’s research team forecasts markets. Based on just 15 leading indicators we identify the dominant trend(s) in global markets. While researching we have found especially one chart that needs attention: 20-year Treasuries in the U.S. This qualifies as the most scary chart of 2019.

InvestingHaven’s research team has a very strict method when it comes to understanding the dominant market trend. As per our ‘intermarket dynamics’ viewpoint capital flows between assets. So charts highlight which assets get an influx and which ones fall victim of capital outflows.

As explained in our 100 tips for successful long term investing:

When leading assets arrive at decision levels they can do either of three things. Either they break out, they break down or bounce back. In doing so, they influence other assets. This is the basis for a new market trend where several markets are part of a similar type of trend.

In researching the new trend(s) of markets we know that currencies and credit markets are the most important place to look for major turning points in markets. They have determined major changes in the last decades, and they revealed ahead of time the major stock market crashes.

In January 2019 we see the following picture in currencies and credit markets:

The Euro seems to have found support at 114. Similarly, 10 year Treasuries in the U.S. seem to have found support above 2.60. Any break below both levels would spell more turmoil ahead for risk assets, especially stock markets.

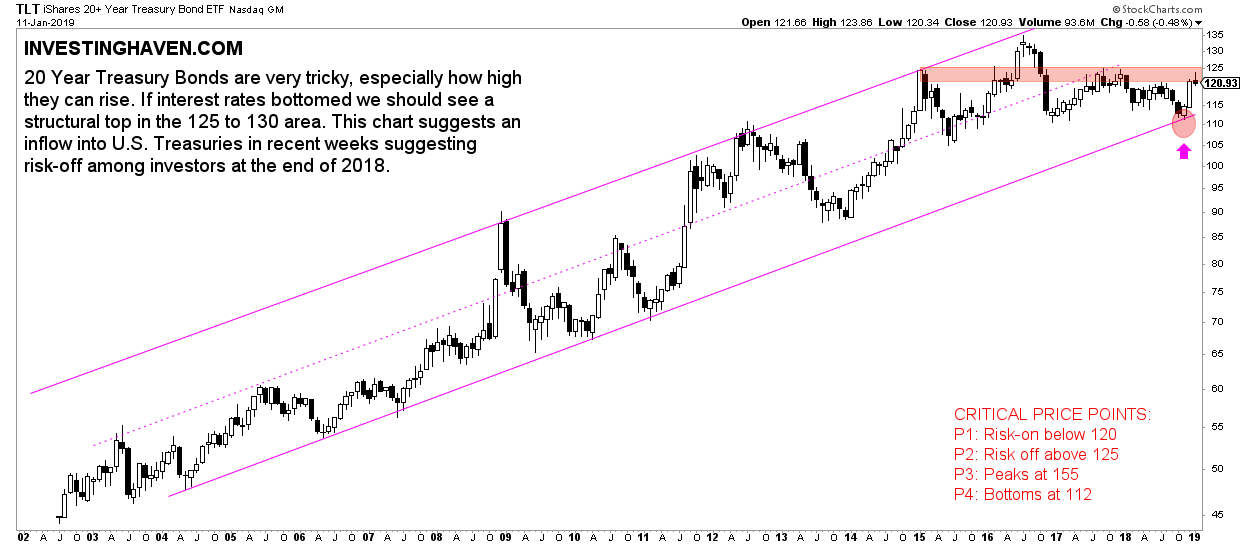
The most scary chart though is 20-year Treasuries, not the rates but the bond prices. As shown below the line in the sand is 125: above 125 it will suggest a strong risk-off sentiment as capital would be flowing massively into Treasuries.

As seen on the chart 20-year Treasuries stopped rising at major support. The million dollar question is what’s next. We are at a major decision point. Note the small area between support at 112 and resistance at 120. Something major is about to happen in 2019!

scary chart 2019

10-YEAR ANNIVERSARY OFFER: InvestingHaven.com celebrates 10 years. Temporarily, you can enjoy a discount on our premium gold/silver and crypto reports. Or you can become a VIP member. Go to our anniversary deals >>
Receive our weekly newsletter.

premium service SP-500 premium service trade alerts premium service crypto teaser 

No related posts.

Tags: TLT
Taki Tsaklanos

Taki Tsaklanos

Taki has +15 years of experience in global markets. He is passionate about forecasting markets - he calls it THE ART OF FORECASTING. His analysis methodology is unique and effective, yet easy to understand; it is based on chart analysis combined with intermarket / fundamental / sentiment analysis. His work appeared on major financial outlets like FinancialSense, MarketWatch,Twitter: twitter.com/investinghaven

Connect with InvestingHaven

Receive top notch forecasts for free.

*We hate spam as you do.

Site Navigation

  • RSS Feed
  • About us
  • Advertising
  • Sponsored Content Policy
  • Mission 2026
  • Sitemap
  • Privacy & Disclaimer
  • Terms of Service
  • Contact Us
investing haven logo

Precious metals market analysis including gold and silver price predictions. Crypto market analysis including highly accurate BTC ETH SOL XRP forecasts.

Copyright © 2025 InvestingHaven

Login to your account below

Forgotten Password?

Fill the forms bellow to register

All fields are required. Log In

Retrieve your password

Please enter your username or email address to reset your password.

Log In

Receive top notch forecasts for free.

*We hate spam as you do.

    InvestingHaven.com honours your privacy. Read our Privacy Policy

    No Result
    View All Result
    • News
    • 2025 Forecasts
      • 10 market predictions
      • Dow Jones forecast 2025
      • S&P 500 forecast 2025
      • Nasdaq prediction 2025
      • Best crypto to buy now
      • Which crypto will explode
      • Best altcoins to buy
      • 15 crypto forecasts 2025
      • Which precious metal to buy
    • Silver articles
      • Silver prediction 2025 – 2030
      • Will silver exceed $30?
      • When will silver hit $50?
      • Can silver hit $100?
      • Silver shortage
      • 50-year silver chart
      • Silver bullish reversal
      • Silver seasonality charts
      • How to invest in silver
    • Gold
      • Gold prediction 2025 – 2030
      • Will gold set new ATH?
      • Will gold hit $3,000?
      • Can gold hit $10,000?
      • Gold chart 10 years
      • Gold chart 50 years
      • Gold chart 100 years
      • Gold silver ratio
      • Gold seasonality charts
    • Commodities
      • Sugar forecasts
      • Coffee forecasts
      • Nickel forecasts
      • Lithium investing
    • Crypto news
    • Crypto forecasts
      • BTC prediction 2025 – 2030
      • ETH prediction 2025 – 2030
      • SOL prediction 2025 – 2030
      • XRP prediction 2025 – 2030
      • XLM prediction 2025 – 2030
      • BNB prediction 2025 – 2030
      • ADA prediction 2025 – 2030
      • AVAX prediction 2025 – 2030
      • KAS prediction 2025 – 2030
      • NEAR prediction 2025 – 2030
      • BCH prediction 2025 – 2030
      • LINK prediction 2025 – 2030
      • DOT prediction 2025 – 2030
      • SUI prediction 2025 – 2030
      • ICP prediction 2025 – 2030
      • LTC prediction 2025 – 2026
      • STX prediction 2025 – 2030
      • DOGE prediction 2025 – 2030
      • SHIB prediction 2025 – 2030
      • PEPE prediction 2025 – 2030
      • FLOKI prediction 2025 – 2030
      • WIF prediction 2025 – 2030
      • ONDO prediction 2025 – 2030
    • Premium Crypto Alerts
    • Premium services

    Copyright © 2025 InvestingHaven