Investing Haven
No Result
View All Result
Gold Silver Investing >>
CRYPTO INVESTING >>
  • 2025 Forecasts
    • 10 market predictions
    • Dow Jones forecast
    • S&P 500 forecast 2025
    • Nasdaq prediction 2025
    • Best altcoins to buy
    • Best crypto to buy now
    • Which crypto will explode
    • 15 crypto forecasts 2025
    • Which precious metal to buy
  • Silver
    • Silver prediction 2025 – 2030
    • Will silver exceed $30?
    • When will silver hit $50?
    • Can silver hit $100?
    • Silver shortage
    • 50-year silver chart
    • Silver bullish reversal
    • Silver seasonality charts
    • How to invest in silver
  • Gold
    • Gold prediction 2025 – 2030
    • Will gold set new ATH?
    • Will gold hit $3,000?
    • Can gold hit $10,000?
    • Gold chart 10 years
    • Gold chart 50 years
    • Gold chart 100 years
    • Gold silver ratio
    • Gold seasonality charts
  • Commodities
    • Coffee forecasts
    • Sugar forecasts
    • Nickel forecasts
    • Lithium investing
  • Crypto forecasts
    • BTC prediction 2025 – 2030
    • ETH prediction 2025 – 2030
    • SOL prediction 2025 – 2030
    • XRP prediction 2025 – 2030
    • XLM prediction 2025 – 2030
    • BNB prediction 2025 – 2030
    • ADA prediction 2025 – 2030
    • AVAX prediction 2025 – 2030
    • KAS prediction 2025 – 2030
    • NEAR prediction 2025 – 2030
    • BCH prediction 2025 – 2030
    • LINK prediction 2025 – 2030
    • DOT prediction 2025 – 2030
    • SUI prediction 2025 – 2030
    • ICP prediction 2025 – 2030
    • LTC prediction 2025 – 2026
    • STX prediction 2025 – 2030
    • DOGE prediction 2025 – 2030
    • SHIB prediction 2025 – 2030
    • PEPE prediction 2025 – 2030
    • FLOKI prediction 2025 – 2030
    • WIF prediction 2025 – 2030
    • ONDO prediction 2025 – 2030
  • News
    • Crypto news
    • Commodities
  • Login
Investing Haven
No Result
View All Result

Home » Markets & Stocks » NYSE Composite Index 50 Year Long Term Chart

NYSE Composite Index 50 Year Long Term Chart

Taki T. by Taki T.
December 16, 2018
in Markets & Stocks
NYSE composite
2.3k
VIEWS
Share on FacebookShare on Twitter

The New York Stock Exchange Index (NYSE) is an extremely important gauge of overall market health. Likewise, the NYSE Composite Index is an important indicator to watch for understanding U.S. stock market health. In a time where some are fearful about a global market crash in 2019 it is imperative to also look into the dominant trend of the NYSE Composite Index. This article features highlights of the NYSE Composite Index 50 year long term chart.

Interestingly the New York Stock Exchange says on its own site that is has been the “premier exchange of choice for innovators, visionaries, and leaders for over 225 years” but also that “during global events, turmoil and volatility, investors turn to the NYSE”.

The importance of the NYSE Composite Index

Wikipedia provides some more detail on the NYSE Composite Index saying that it is a stock market index covering all common stock listed on the New York Stock Exchange, including American depositary receipts, real estate investment trusts, tracking stocks, and foreign listings. It also says that over 2,000 stocks are covered in the index, of which over 1,600 are from United States corporations and over 360 are foreign listings.

This broad coverage across different levels of market cap as well as industries is the reason why the NYSE Composite Index is a reliable indicator for overall market health.

The NYSE Composite Index 50 year long term chart

In our leading indicators for a potential global market crash we included the Russell 2000 as well as the German DAX. However, a complementary indicator would be the NYSE Composite Index 50 year long term chart with its dominant trends. We did not include it in our previous article just to keep the list of leading stock indicators concise.

What can we conclude from the NYSE Composite Index 50 year long term chart?

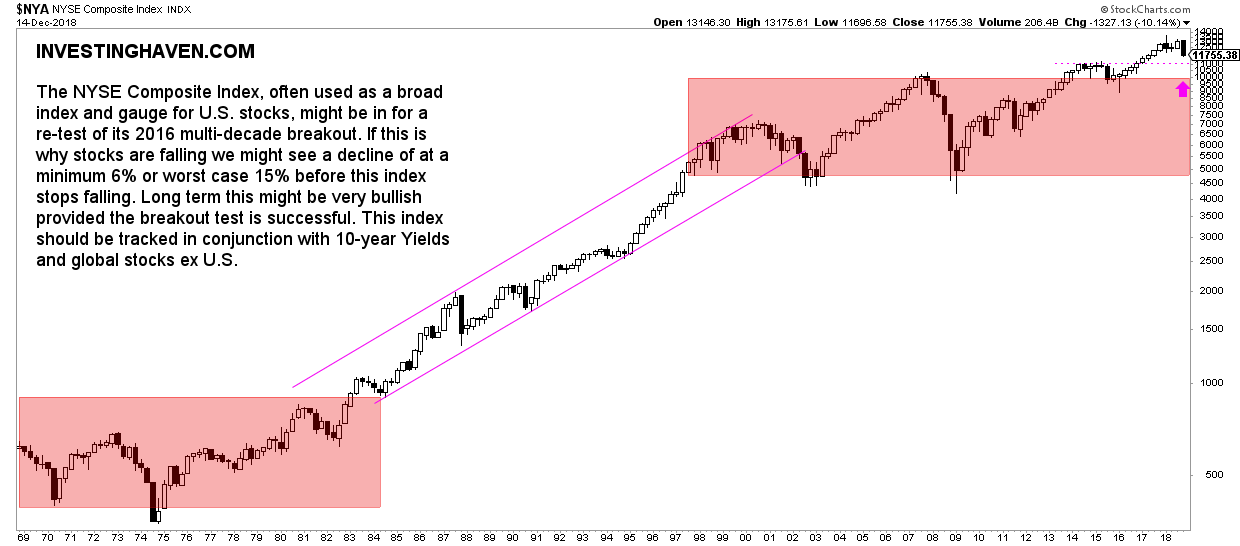
  • First, there are 3 distinct periods in terms of secular and dominant trends. The period until 1982-1984 was a long term consolidation period, there was a giant rise until 2000, and then another consolidation between 2000 and 2015.
  • Second, since 2016 we are technically in a new period which may be setting up for another giant bull market. At least, that’s what we see on the long term chart between 2016 and 2018.
  • Third, the NYSE Composite Index seems to be weakening now, which is no surprise given recent market turmoil. But the million dollar question is how low the NYSE Composite Index will fall.

The NYSE Composite Index 50 year long term chart suggests there is no issue if this index would fall to the 11,000 level, even not to the 10,000 level. It would present a normal breakout test.

NYSE Composite Index 50 year still bullish

Provided the 10,000 level holds strong, and, preferably, the 11,000 level holds up, there is no issue whatsoever in the bigger scheme of things. It would simply validate the thesis that a new long term bull market in stocks started in 2016.

We believe it is important enough to consider the NYSE Composite Index together with the leading risk indicators Russell 2000 and 10-year Yields. All combined will reveal the risk level and their impact on leading stock indicators.

Below is the NYSE Composite Index 50 year long term chart with our annotations.

NYSE composite 50 year long term chart

10-YEAR ANNIVERSARY OFFER: InvestingHaven.com celebrates 10 years. Temporarily, you can enjoy a discount on our premium gold/silver and crypto reports. Or you can become a VIP member. Go to our anniversary deals >>
Receive our weekly newsletter.

premium service SP-500 premium service trade alerts premium service crypto teaser 

No related posts.

Tags: NYA
Taki T.

Taki T.

Taki is a chart analyst who is passionate about unlocking unique insights out the chart. While the vast majority of analysts remain focused on price analysis, Taki starts with timeline analysis and adds price analysis to this. In doing so, he developed a unique methodology to find opportunities in financial markets, across assets and markets.

Connect with InvestingHaven

Receive top notch forecasts for free.

*We hate spam as you do.

Site Navigation

  • RSS Feed
  • About us
  • Advertising
  • Sponsored Content Policy
  • Mission 2026
  • Sitemap
  • Privacy & Disclaimer
  • Terms of Service
  • Contact Us
investing haven logo

Precious metals market analysis including gold and silver price predictions. Crypto market analysis including highly accurate BTC ETH SOL XRP forecasts.

Copyright © 2025 InvestingHaven

Login to your account below

Forgotten Password?

Fill the forms bellow to register

All fields are required. Log In

Retrieve your password

Please enter your username or email address to reset your password.

Log In

Receive top notch forecasts for free.

*We hate spam as you do.

No Result
View All Result
  • News
  • 2025 Forecasts
    • 10 market predictions
    • Dow Jones forecast 2025
    • S&P 500 forecast 2025
    • Nasdaq prediction 2025
    • Best crypto to buy now
    • Which crypto will explode
    • Best altcoins to buy
    • 15 crypto forecasts 2025
    • Which precious metal to buy
  • Silver articles
    • Silver prediction 2025 – 2030
    • Will silver exceed $30?
    • When will silver hit $50?
    • Can silver hit $100?
    • Silver shortage
    • 50-year silver chart
    • Silver bullish reversal
    • Silver seasonality charts
    • How to invest in silver
  • Gold
    • Gold prediction 2025 – 2030
    • Will gold set new ATH?
    • Will gold hit $3,000?
    • Can gold hit $10,000?
    • Gold chart 10 years
    • Gold chart 50 years
    • Gold chart 100 years
    • Gold silver ratio
    • Gold seasonality charts
  • Commodities
    • Sugar forecasts
    • Coffee forecasts
    • Nickel forecasts
    • Lithium investing
  • Crypto news
  • Crypto forecasts
    • BTC prediction 2025 – 2030
    • ETH prediction 2025 – 2030
    • SOL prediction 2025 – 2030
    • XRP prediction 2025 – 2030
    • XLM prediction 2025 – 2030
    • BNB prediction 2025 – 2030
    • ADA prediction 2025 – 2030
    • AVAX prediction 2025 – 2030
    • KAS prediction 2025 – 2030
    • NEAR prediction 2025 – 2030
    • BCH prediction 2025 – 2030
    • LINK prediction 2025 – 2030
    • DOT prediction 2025 – 2030
    • SUI prediction 2025 – 2030
    • ICP prediction 2025 – 2030
    • LTC prediction 2025 – 2026
    • STX prediction 2025 – 2030
    • DOGE prediction 2025 – 2030
    • SHIB prediction 2025 – 2030
    • PEPE prediction 2025 – 2030
    • FLOKI prediction 2025 – 2030
    • WIF prediction 2025 – 2030
    • ONDO prediction 2025 – 2030
  • Premium Crypto Alerts
  • Premium services

Copyright © 2025 InvestingHaven