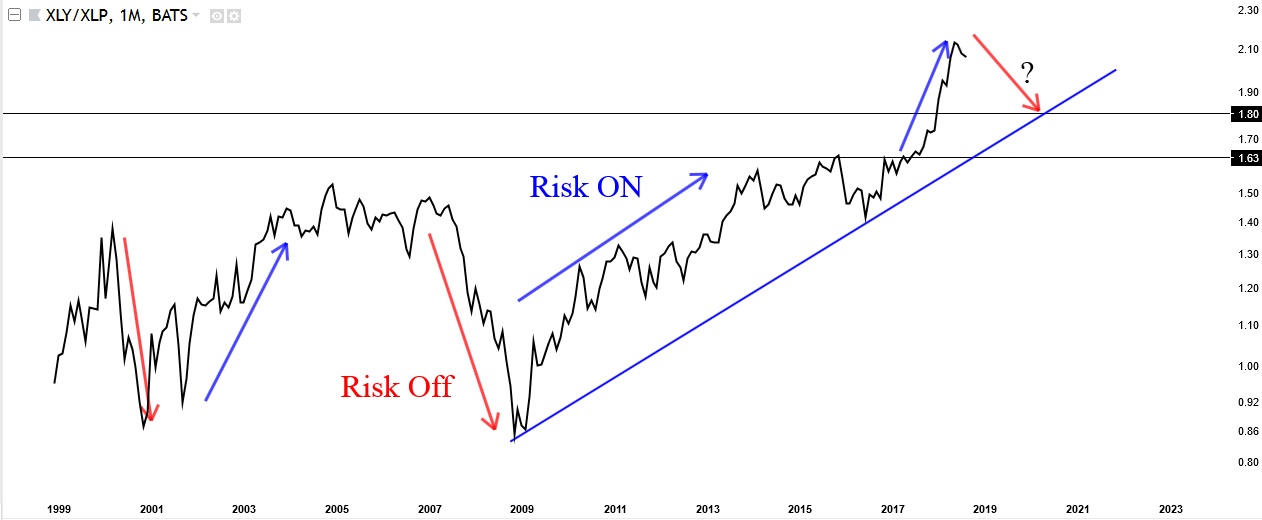
Smart investors apply a top-down approach when investing. They start with the highest level view which is the answer to the question: are markets in a ‘risk on’ or ‘risk off’ mode. The answer to this question determines which type of asset should be invested, for instance stocks vs bonds vs commodities. InvestingHaven was spot-on in determining ‘risk on’ since February/March of 2018. However, right now, markets may (temporarily) fall back to a short to medium term ‘risk off’ mode, this is why.
There are hundreds of risk indicators, the internet is full of articles that talk about risk indicators. However, it is only a few of them that really have some predictive value, and it’s worth applying the ‘less is more’ principle to identify them.
One of the few risk indicators we follow is the consumer discretionary vs. consumer staple ratio. Is is a ratio of two stock market sectors. The former is a ‘risk on’ indicator while the latter is a risk averse indicator and suggests ‘risk off’. They are based on stock market sectors, in particular XLY ETF and XLP ETF.
XLY is the consumer discretionary stock market sector representing companies that offer or produce luxury goods or services. These do not fulfill the basic needs. The products and services that make up the basic needs are part of the consumer staples sector, represented by the XLP.
This ratio is a simple yet effective method to understand and monitor risk on vs risk off.
‘Risk on’ vs. ‘risk off’ in the next months of 2018?
Here it becomes interesting. When the ratio XLY to XLP increases it suggests that investors are more leaning towards luxury items with a higher risk (discretionary), an proxy for ‘risk on’ for investors. However, when the ratio XLY to XLP decreases investors are more conservative, and tend to focus more basic items, a proxy for ‘risk off’ for investors.
As can be seen from the most recent XLY to XLP ratio chart embedded below it seems that there could be a sizable retracement underway. The ratio may be moving to the 1.8 ratio in the coming 6 months, and, worst case, it could retest the 1.6 ratio, the point where it broke out early 2017.
This has the potential to drag the entire market down unless sector rotation may take place. At this point in time we would urge investors to exercise some caution, and follow leading risk indicators closely as well as different sectors in the market to identify potential sector and asset rotation. We will write extensively about this the coming weeks.


