The summer rally is over and the market is preparing a consolidation and a pullback. We explained why we think so in Apple About To Lead The S&P 500 And Nasdaq Lower In September. Many investors missed the recent summer rally, because of extreme fear and bearish bias (after cataclysmic price action between June 6th and 16th). It is ok to miss a rally, however it is not ok to miss the learnings from a rally. We derived a lot of great insights from the recent rally. One of the key insights is reflected in our latest stocks shortlist update (mega trend confirmation). We feature, in this short post, one absolutely beautiful chart setup from our latest shortlist selection: SOL.
SOL is a small cap. What’s important to realize is that a stock like SOL comes with leverage, however it tends to create momentum near the end of a long term bullish trend.
Stated differently, don’t expect SOL to come with an immediate rally. It might take some time, but it’s clear that a long and strong bullish reversal is unfolding. It might take another 9 to 12 months until SOL accelerates its move higher (maybe ‘only’ 6 months)… but do we really care about the timeframe? The most important thing is that get the trend right and that we invest with the trend.
Here is one really important insight for serious investors: Beauty Results In Profitable Investments. This is one of the most important tips in our series successful investing tips. We jokingly concluded:
Beauty matters in real life in almost all domains of our life. It should matter when you invest in financial markets.
This is the short version of the article about beauty, charts and investments:
There is a way to recognize whether an investment is beautiful. Surprise surprise, it’s the chart that shows beauty. Easy answer right, if so why isn’t it the key topic of any investment advice, premium service, mainstream financial content, gurus and the likes?
A beautiful chart setup has nothing to do with technical analysis or chart analysis. A beautiful chart reflects a structured supply/ demand situation. Investors and traders are aligned on key support levels, and also on timing the uptrend. That’s what it is: no chaos between traders, investors on short and long term timeframes. There is harmony on the supply/ demand side which ultimately is reflected in the chart structure.
Beauty relates to structure.
Structure is evidence of harmony between supply and demand.
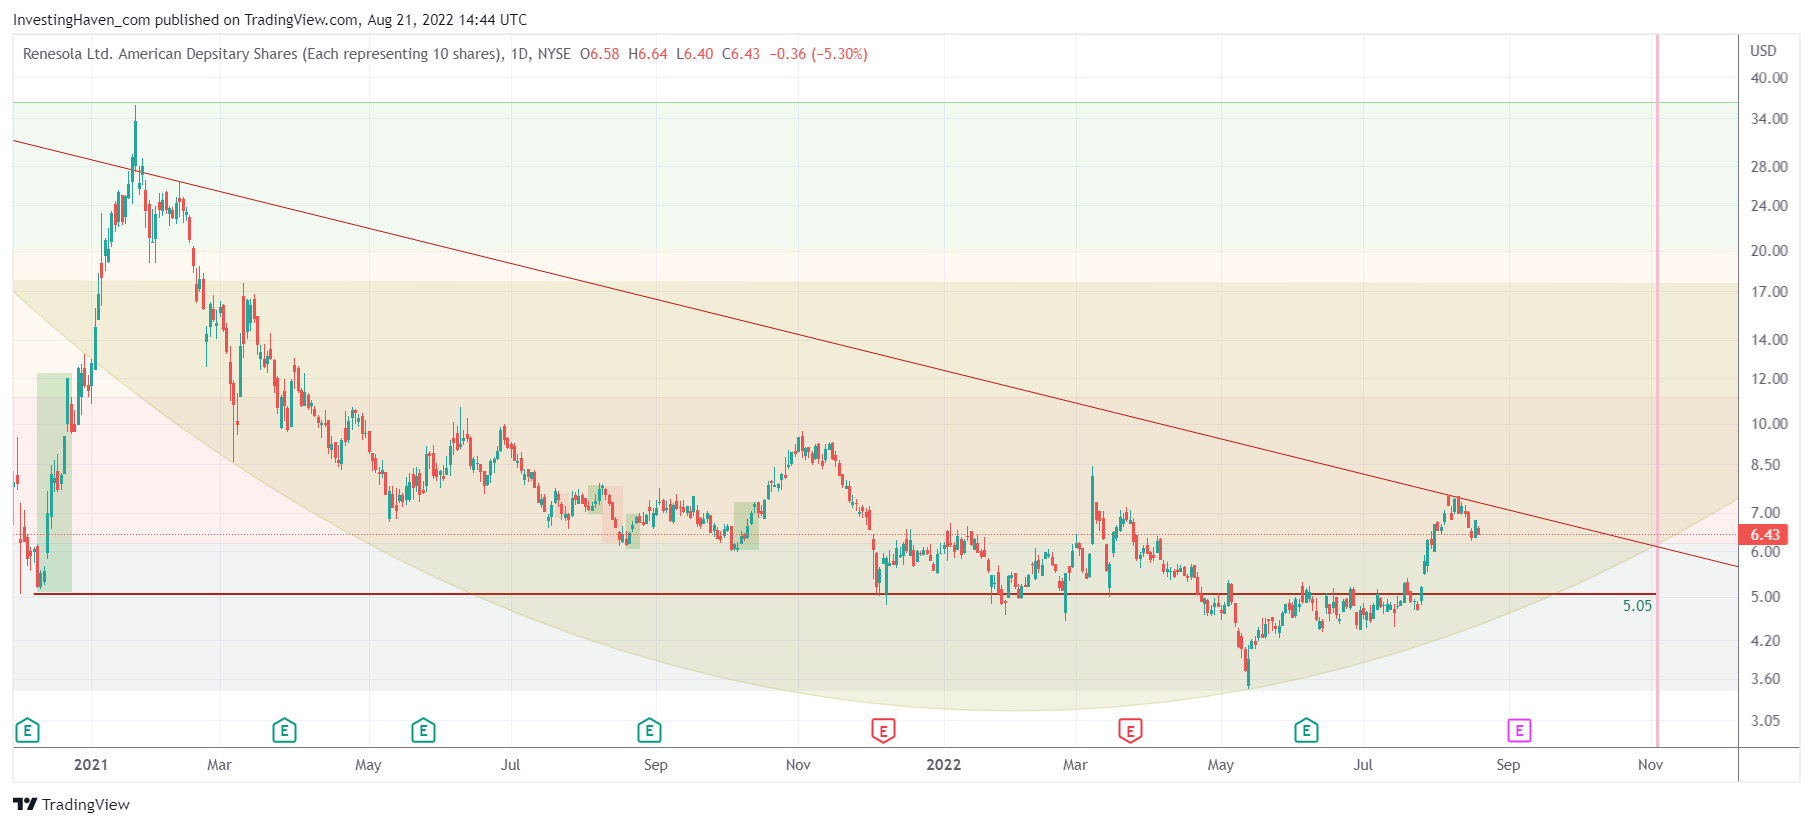
The SOL chart is a great illustration of what is becoming a really beautiful chart.
Trendlines and other chart analysis tools do help, but the bigger picture structure is what matters. The structure of SOL is in the process of creating more beauty with each passing week and month. Its chart exhibits an orderly bullish reversal, one with a high level of confidence as it relates to its outcome.
What we absolutely require is that SOL continues to respect key support levels. It also should set higher lows.
SOL has a really important date coming up: November 3d (see vertical line). We combine this with the date that we derived from our big picture market analysis: December 1st.
Whatever happens on the SOL chart in the next 2 months and then in the decisive time window in November is going to confirm or invalidate the beauty that is currently being created on the SOL chart.
SOL is part of several ETFs like PBW and TAN. We don’t like playing ETFs, we want to pick the absolute winners in each sector. That’s why we track SOL as one of the candidates to outperform the market in the cycle that started on July 18th, 2022 and which we expect to end around Nov 9th, 2023. Our stocks shortlist will determine if and when we believe SOL qualifies as one of the most ‘beautiful investments’ in this new 18 month market cycle. Moreover, in our Momentum Investing service we feature a few even more relevant and interesting SOL insights.


