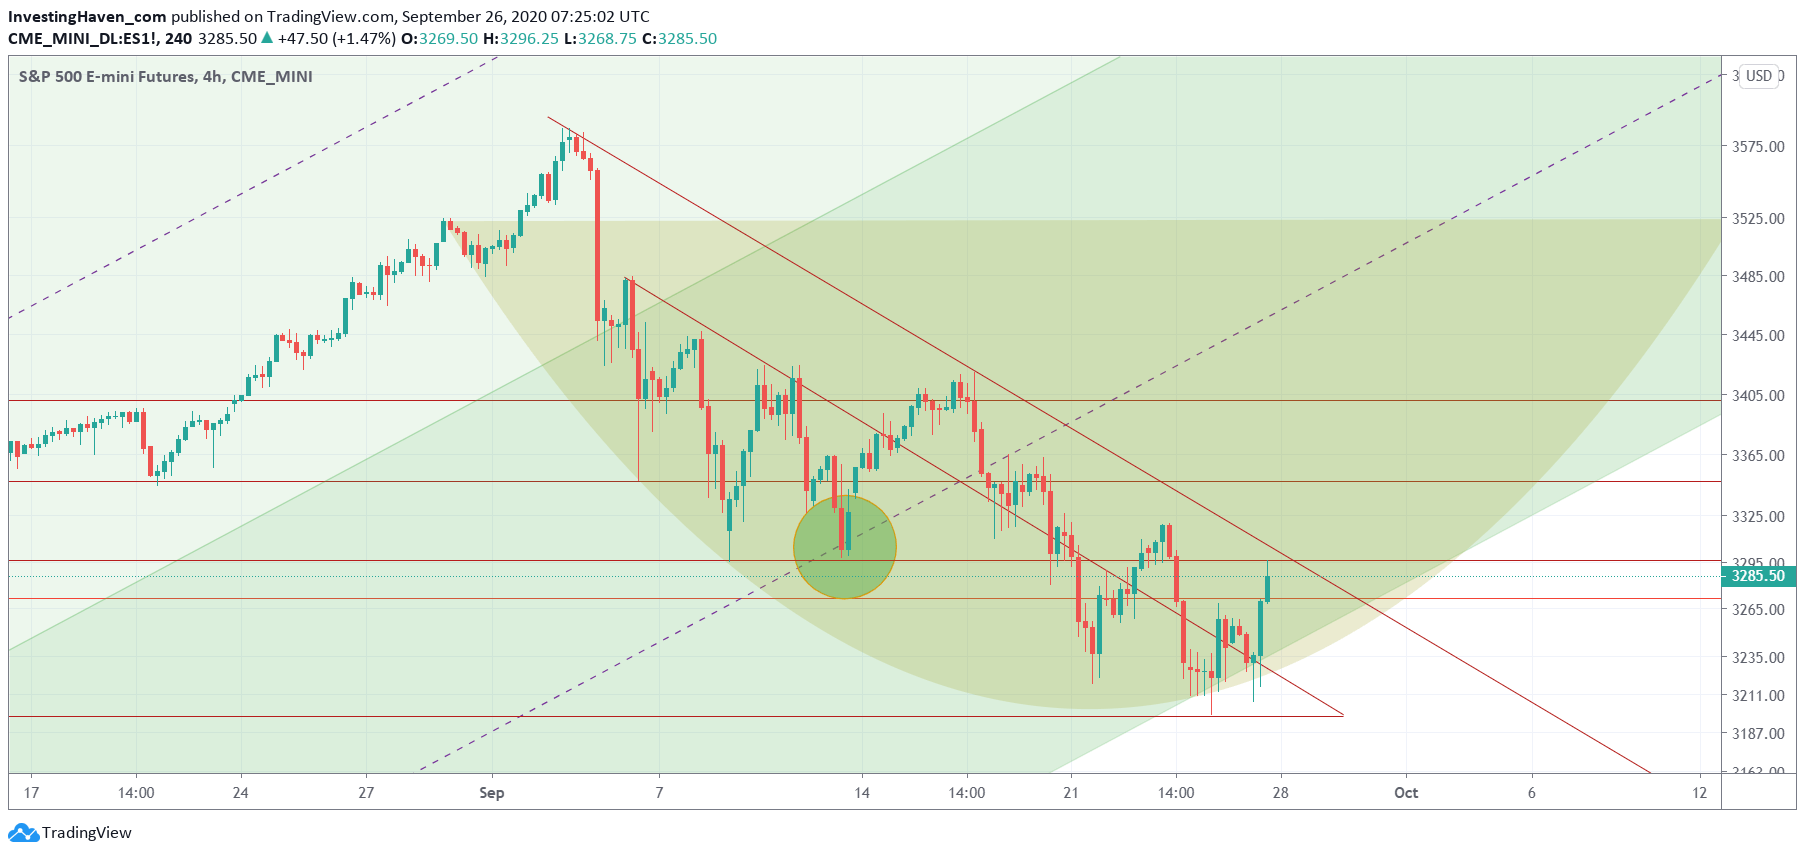
The S&P 500 chart is hitting major support, as in *major* support. Stock market bulls don’t want to see the current levels be violated. But bulls can also not yet start celebrating, as the most important bull market test is just around the corner. The jury is still out for stock market investors. We are not forecasting the short term, we only identify bull and bear market levels.
The chart embedded in this article is the 4hour S&P 500 chart.
It magnifies the September decline (yellow), and maps it to the underlying uptrends (green). In other words all we do is add structure to an otherwise unstructured chart.
Pretty fascinating setup, isn’t it?
- The decline was pretty violating, and broke through every short to medium term support level imaginable.
- The decline pierced from the top to the support of the uptrend channel.
- The reversal that bulls are trying to create on this chart is huge, but a slow one.
- There is plenty of overhead resistance here until the bulls can have their day.
- First and foremost, the 3295 point level is the most important level to overcome.
- After this, the 3425 level is the ultimate ‘break up’ level for the bulls.
- Bears tried hard, but failed as well to trigger a major breakdown. There are many attempts to push below 3215 points, but they all failed.
Bears will have a very hard time creating a breakdown, bulls have a lot of work. Not easy, is what this chart says.
Given that the bulls have an edge at this poit in time we did take 2 positions on Friday: a position in our short term portfolio, and one social media stock in our medium term portfolio.


