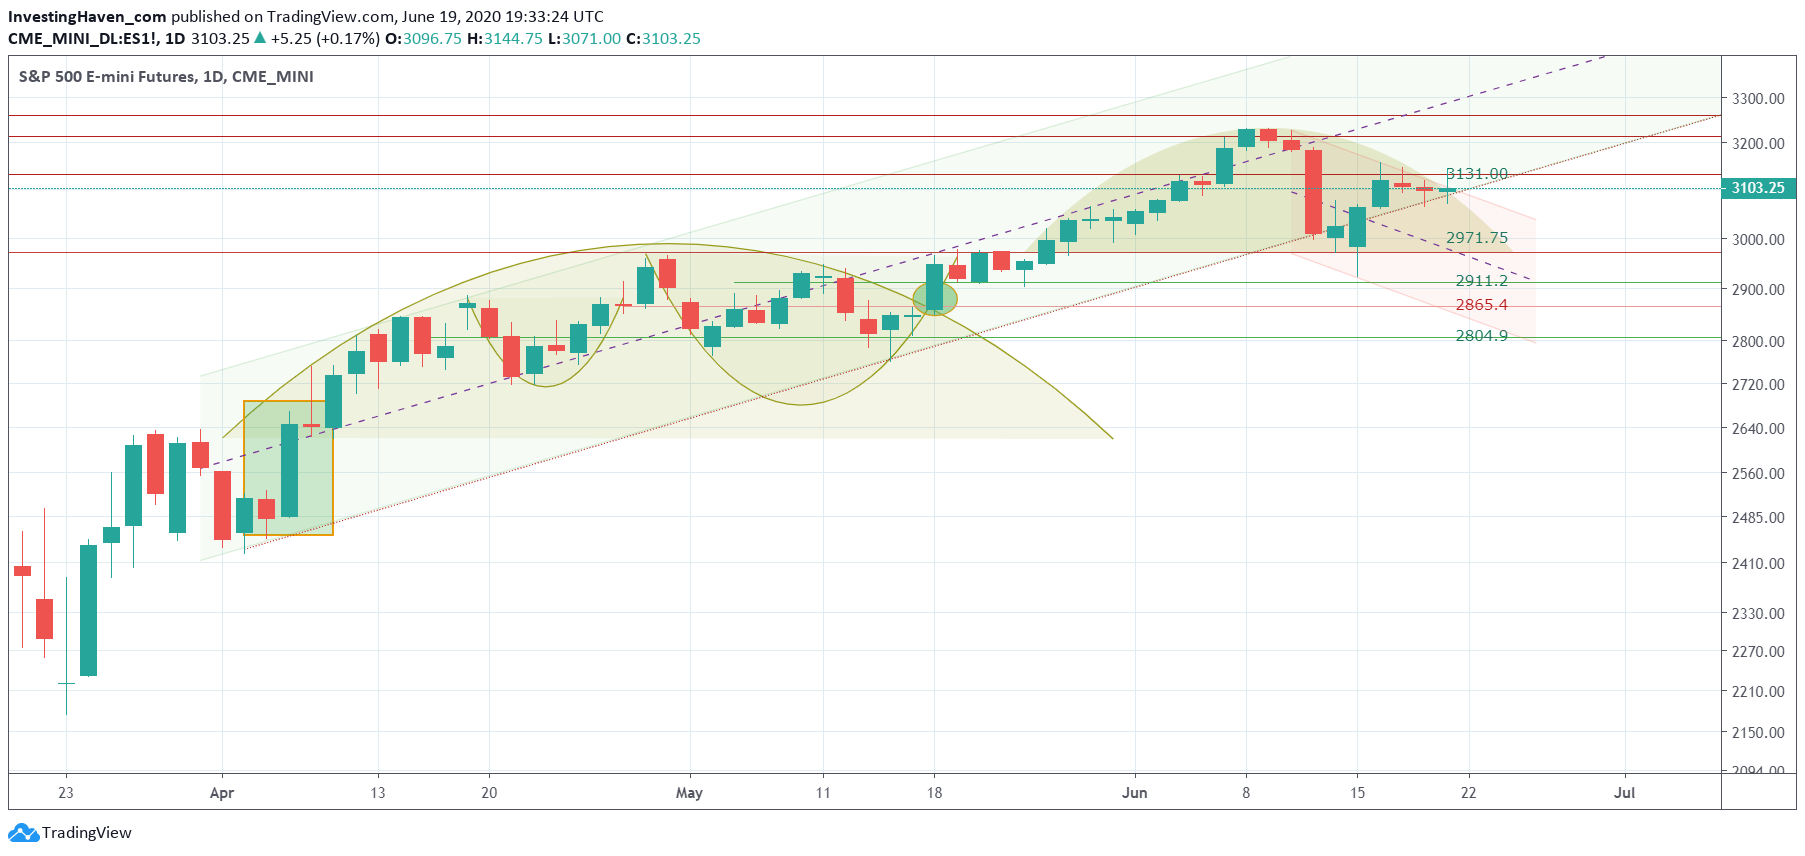
Further to our leading risk indicator analysis Leading Risk Indicator Struggling. A Bearish Period Ahead? we want to look at the broad market index S&P 500 to understand the ongoing vs. potential trend(s). Interestingly, the S&P 500 chart is now right at a make or break level.
We have to start by mentioning the source of this chart. This is the SPX chart with our own annotations, and the source is the weekend edition of our premium service. This is just one of the many charts that our members receive during the week (special edition in case the market takes an unexpected turn) or in the weekend edition (educational updates).
The green rising trend is the one that started right after the cataclysmic Corona crash.
The light red (short) channel is the one that may have started on June 10th, right after the U.S. Fed speech, after which some sudden and brutal volatility kicked in for a few days.
The S&P 500 is really testing the intersection between both patterns.
In other words bulls and bears are struggling to win the battle.
The jury is out, the market has not found a direction yet.
We will follow the ‘events’ on this chart closely, as well as on our proprietary ‘crash indicator methodology’, to understand the direction of the market.
Do you like our analysis? You can follow our work with our look-over-the-shoulder investing method and strategy.


