Treasuries are in free fall. It’s scary, as scary as their spike last year during the Corona crash! The difference: last year they triggered a stock market crash, this year they are triggering a stock market boom. Even our bullish Dow Jones forecast will get crushed this year. Several commodities like cobalt and lithium will do extremely well in 2021.
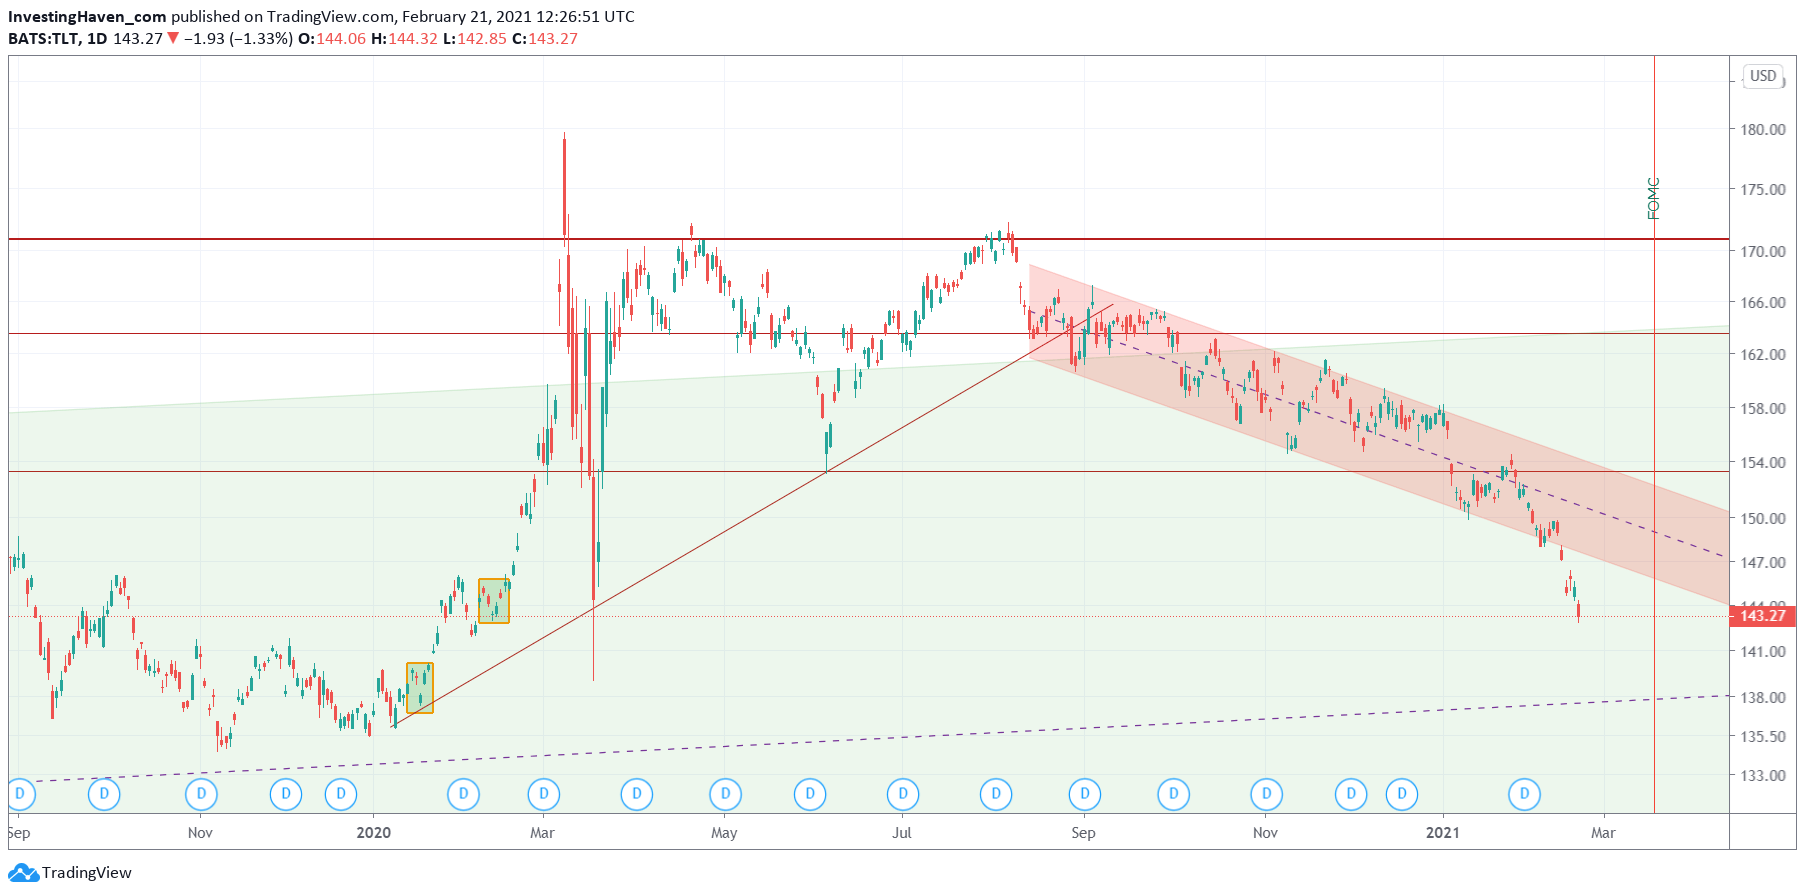
The daily TLT chart, representing 20 year Treasuries, has a gigantic bearish M-pattern. It started in the first week of January of 2020.
Moreover, the recent downtrend represented by the red falling channel got crushed last week (breakdown, that is).
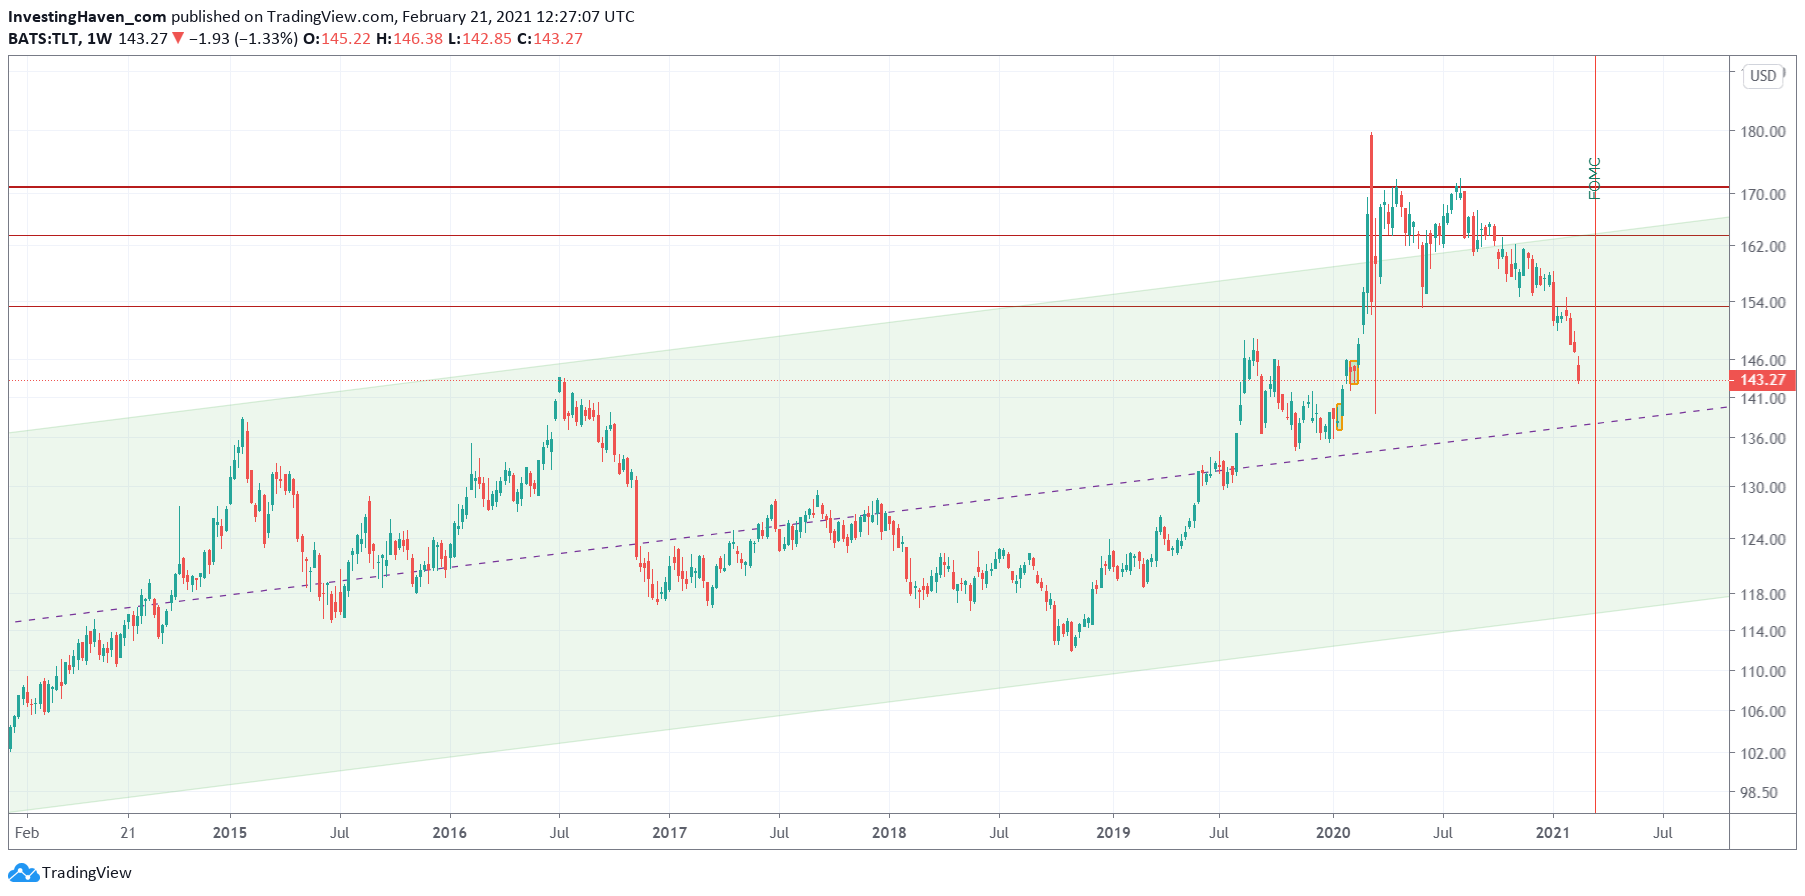
To understand all this we need to zoom out. The weekly chart is shown below, and shows the magnitude of the ongoing breakdown.
This is huge, a monster breakdown.
TLT is clearly falling to 138 points now, where it may find support. That’s the median line of its secular channel.
If and when it hits it we will see a healthy retracement in stocks. Between now and then stocks will be bullish as said in Leading Global Stock Index Almost Parabolic: Opportunity And Risk.
Eventually, the peak of this stock bull market will be when TLT falls back to 118 – 120 points. That’s a lot of downside in TLT, and a lot of upside in stocks!


