Investing Haven
No Result
View All Result
Gold Silver Investing >>
CRYPTO INVESTING >>
  • 2025 Forecasts
    • 10 market predictions
    • Dow Jones forecast
    • S&P 500 forecast 2025
    • Nasdaq prediction 2025
    • Best altcoins to buy
    • Best crypto to buy now
    • Which crypto will explode
    • 15 crypto forecasts 2025
    • Which precious metal to buy
  • Silver
    • Silver prediction 2025 – 2030
    • Will silver exceed $30?
    • When will silver hit $50?
    • Can silver hit $100?
    • Silver shortage
    • 50-year silver chart
    • Silver bullish reversal
    • Silver seasonality charts
    • How to invest in silver
  • Gold
    • Gold prediction 2025 – 2030
    • Will gold set new ATH?
    • Will gold hit $3,000?
    • Can gold hit $10,000?
    • Gold chart 10 years
    • Gold chart 50 years
    • Gold chart 100 years
    • Gold silver ratio
    • Gold seasonality charts
  • Commodities
    • Coffee forecasts
    • Sugar forecasts
    • Nickel forecasts
    • Lithium investing
  • Crypto forecasts
    • BTC prediction 2025 – 2030
    • ETH prediction 2025 – 2030
    • SOL prediction 2025 – 2030
    • XRP prediction 2025 – 2030
    • XLM prediction 2025 – 2030
    • BNB prediction 2025 – 2030
    • ADA prediction 2025 – 2030
    • AVAX prediction 2025 – 2030
    • KAS prediction 2025 – 2030
    • NEAR prediction 2025 – 2030
    • BCH prediction 2025 – 2030
    • LINK prediction 2025 – 2030
    • DOT prediction 2025 – 2030
    • SUI prediction 2025 – 2030
    • ICP prediction 2025 – 2030
    • LTC prediction 2025 – 2026
    • STX prediction 2025 – 2030
    • DOGE prediction 2025 – 2030
    • SHIB prediction 2025 – 2030
    • PEPE prediction 2025 – 2030
    • FLOKI prediction 2025 – 2030
    • WIF prediction 2025 – 2030
    • ONDO prediction 2025 – 2030
  • News
    • Crypto news
    • Commodities
  • Login
Investing Haven
No Result
View All Result

Home » Markets & Stocks » The Market Will Not Move 50% Lower Contrary To What The Gurus Are Telling You

The Market Will Not Move 50% Lower Contrary To What The Gurus Are Telling You

Taki T. by Taki T.
November 28, 2023
in Markets & Stocks
bank stock crash
1.9k
VIEWS
Share on FacebookShare on Twitter

An epic shake-out took place in markets on October 13th, 2022. It will be a date that many investors will remember for the rest of their lives as their nasty shake-out moment. We are on record with an estimate that at least 50% of retail investors pressed the SELL button on 10.13.2022, completely panicked, only to see the market move higher a few hours later. As said in our 2023 forecasts and our the markets will move higher, not lower, going into 2023. That’s also consistent with the conclusions from the Dow Jones 100 year chart.

Here is the problem with the situation that occurred on October 13th, 2022: once an investor sells at or near the bottom, its mindset changes entirely. It is a very normal and human reaction, however it may not be a profitable reaction.

As explained in 7 secrets of investing success investors need to be counterintuitive. That’s easier said than done, for sure, especially when volatility is elevated and persistent for 9 months in a row (which is the behavior of the market since the first days of January).

Needless to say, whenever there is a confirmed real breakdown it is justified to exit the market and reduce positions. So, the point from this week is this: did markets set an epic bottom or is the real breakdown underway? Stated differently, was it wise to sell on October 13th, 2022 or was it wise to hold onto your positions.

We firmly believe it is the latter. We firmly believe the bottom is set in markets, for a variety of reasons. We firmly believe that our recommended HOLD strategy in 2022 is going to be proven the right one, in a few months from now.

This is why.

First, leading indicators show that volatility has topped. We analyze 6 distinct volatility indexes that help us tremendously reading markets and provide great complementary value next to the analysis of stock indexes. One of them volatility indexes we track is the Nasdaq volatility index.

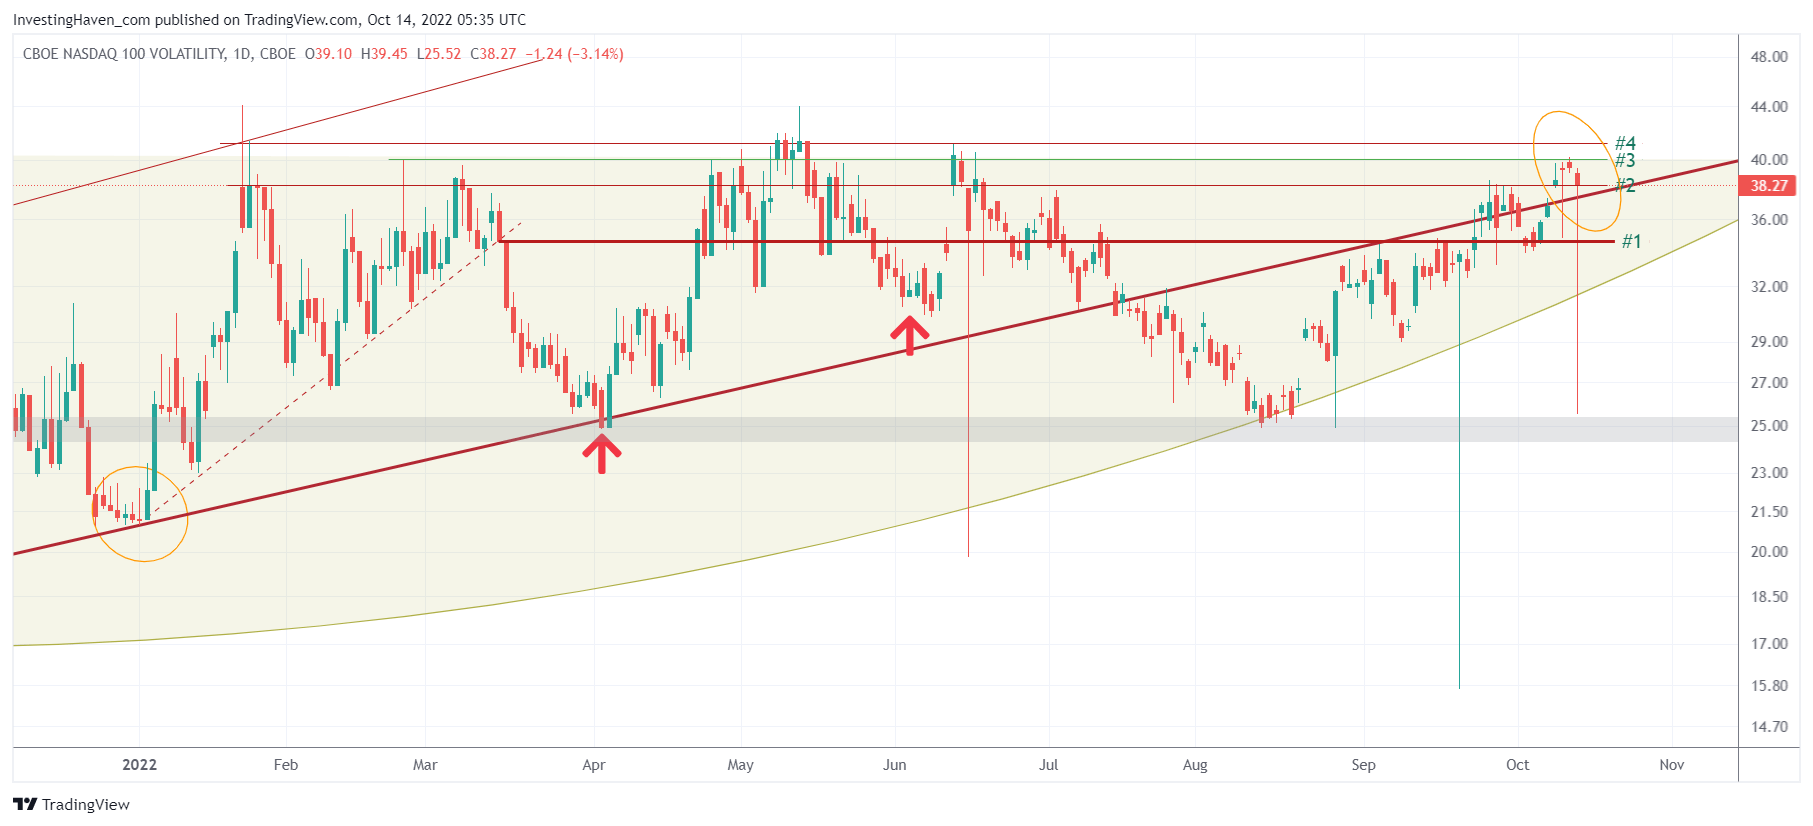
As seen on the Nasdaq volatility index there was a topping pattern in the making, going into the magic date of October 13th, 2022. We were convinced the market was working on a bottom, ideally a washout bottom, which is exactly what happened!

Second, our leading indicators all showed exhaustion signals. Think of the USD, as one of our leading indicators. Leading indicators don’t lie.

Third, the market knows very well how the investment community thinks. The focus is on horizontal levels. We are not saying that horizontal levels are not important, we are certainly saying there is so much more than horizontal levels. Think of volatility indexes and leading indicators that come with solid insights to avoid being trapped in the failed breakdown that happens so often when horizontal levels are breached.

Fourth, the CPI data were really not so bad to trigger a massive breakdown. Investors need to stay data driven and fact focused. Emotions are horrible triggers for investing decisions.

Last but not least, the leading stock indexes charts were clearly moving back to their Oct/Nov 2020 breakout point. In a way, the violent move lower in 2022 qualifies as a successful breakout test, pending final validation, with the lows set on Oct 13th, 2022.

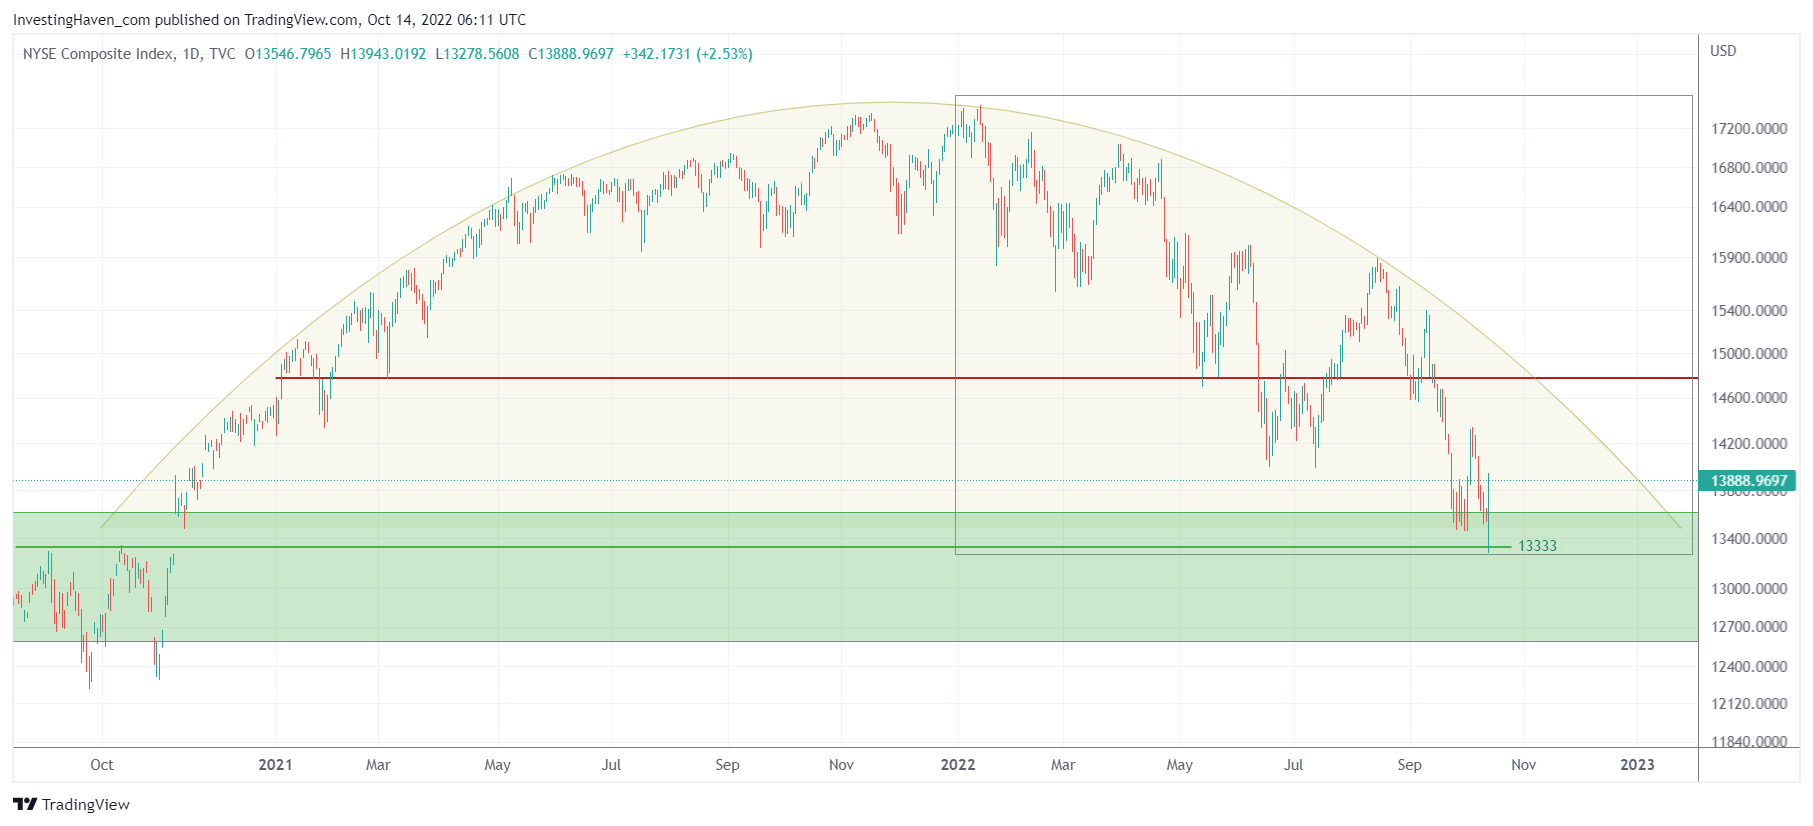
Note that the NYSE Composite Index, chart above, visualizes the ‘breakout back-test’ in a clearer and cleaner way than the SPX / Nasdaq / Russell 2000 charts.

Gurus are making you scared with their doomsday scenario forecasts. The market is not going to move 50% lower from here, which is what ‘they’ are telling you. This is not Oct 2008 all over again. You can read our viewpoint, backed with data and charts, in our premium update sent to Momentum Investing members to find out why we believe the market has bottomed.


10-YEAR ANNIVERSARY OFFER: InvestingHaven.com celebrates 10 years. Temporarily, you can enjoy a discount on our premium gold/silver and crypto reports. Or you can become a VIP member. Go to our anniversary deals >>
Receive our weekly newsletter.

premium service SP-500 premium service trade alerts premium service crypto teaser 

No related posts.

Tags: 2023 ForecastsNASDAQNYSESPXvxn
Taki T.

Taki T.

Taki is a chart analyst who is passionate about unlocking unique insights out the chart. While the vast majority of analysts remain focused on price analysis, Taki starts with timeline analysis and adds price analysis to this. In doing so, he developed a unique methodology to find opportunities in financial markets, across assets and markets.

Connect with InvestingHaven

Receive top notch forecasts for free.

*We hate spam as you do.

Site Navigation

  • RSS Feed
  • About us
  • Advertising
  • Sponsored Content Policy
  • Mission 2026
  • Sitemap
  • Privacy & Disclaimer
  • Terms of Service
  • Contact Us
investing haven logo

Precious metals market analysis including gold and silver price predictions. Crypto market analysis including highly accurate BTC ETH SOL XRP forecasts.

Copyright © 2025 InvestingHaven

Login to your account below

Forgotten Password?

Fill the forms bellow to register

All fields are required. Log In

Retrieve your password

Please enter your username or email address to reset your password.

Log In

Receive top notch forecasts for free.

*We hate spam as you do.

No Result
View All Result
  • News
  • 2025 Forecasts
    • 10 market predictions
    • Dow Jones forecast 2025
    • S&P 500 forecast 2025
    • Nasdaq prediction 2025
    • Best crypto to buy now
    • Which crypto will explode
    • Best altcoins to buy
    • 15 crypto forecasts 2025
    • Which precious metal to buy
  • Silver articles
    • Silver prediction 2025 – 2030
    • Will silver exceed $30?
    • When will silver hit $50?
    • Can silver hit $100?
    • Silver shortage
    • 50-year silver chart
    • Silver bullish reversal
    • Silver seasonality charts
    • How to invest in silver
  • Gold
    • Gold prediction 2025 – 2030
    • Will gold set new ATH?
    • Will gold hit $3,000?
    • Can gold hit $10,000?
    • Gold chart 10 years
    • Gold chart 50 years
    • Gold chart 100 years
    • Gold silver ratio
    • Gold seasonality charts
  • Commodities
    • Sugar forecasts
    • Coffee forecasts
    • Nickel forecasts
    • Lithium investing
  • Crypto news
  • Crypto forecasts
    • BTC prediction 2025 – 2030
    • ETH prediction 2025 – 2030
    • SOL prediction 2025 – 2030
    • XRP prediction 2025 – 2030
    • XLM prediction 2025 – 2030
    • BNB prediction 2025 – 2030
    • ADA prediction 2025 – 2030
    • AVAX prediction 2025 – 2030
    • KAS prediction 2025 – 2030
    • NEAR prediction 2025 – 2030
    • BCH prediction 2025 – 2030
    • LINK prediction 2025 – 2030
    • DOT prediction 2025 – 2030
    • SUI prediction 2025 – 2030
    • ICP prediction 2025 – 2030
    • LTC prediction 2025 – 2026
    • STX prediction 2025 – 2030
    • DOGE prediction 2025 – 2030
    • SHIB prediction 2025 – 2030
    • PEPE prediction 2025 – 2030
    • FLOKI prediction 2025 – 2030
    • WIF prediction 2025 – 2030
    • ONDO prediction 2025 – 2030
  • Premium Crypto Alerts
  • Premium services

Copyright © 2025 InvestingHaven