The bullish power that we observe in this market is really strong. The two crash indicators that we closely track are in the process of giving up. One crash indicator is the USD, and we wrote earlier today that the USD was the ‘watchout chart’ for February, now a ‘lame duck’ chart. In this article we look at the other crash indicator: VIX. This crash indicator wrote history week ago, and started an epic breakdown on Friday one hour before the closing bell. Same conclusion as the USD chart analysis: our bullish stock Dow prediction is only about to turn an even more bullish 2021 forecast.
Last week this market wrote history. We explained this in great detail in The Weakest Sell-off In History Is A Fact, and recommend readers to check out the chart in that article. This is a summary of our findings:
- Only 5 instances in the last few decades pushed VIX +70% higher in 3 trading days.
- In all those instances, the damage on SPX ranged from 9.7% to 19.5% in 3 to 4 trading days. The average drop was 12.5% in SPX.
- In all those instances the recovery was slow, and mostly indexes went lower for an extended period of time before moving higher.
- In the last week of January, the SPX impact was a laughable 4.3%, and 4 days later SPX was trading higher than where it started ‘dropping’.
The explosiveness on the VIX chart in the last week of January pushed the SPX index from 3869 to 3695 points, a 4.3% drop, and 4 trading days later SPX hit new highs at 3872.
Fast forward two weeks, and VIX is starting an epic breakdown. THIS is the breaking news that *obviously* does not make it to the front page of Bloomberg Markets, MarketWatch, and the likes.
Needless to say, reporters over there have no clue … and they categorize this type of analysis as technicaly which is a farce.
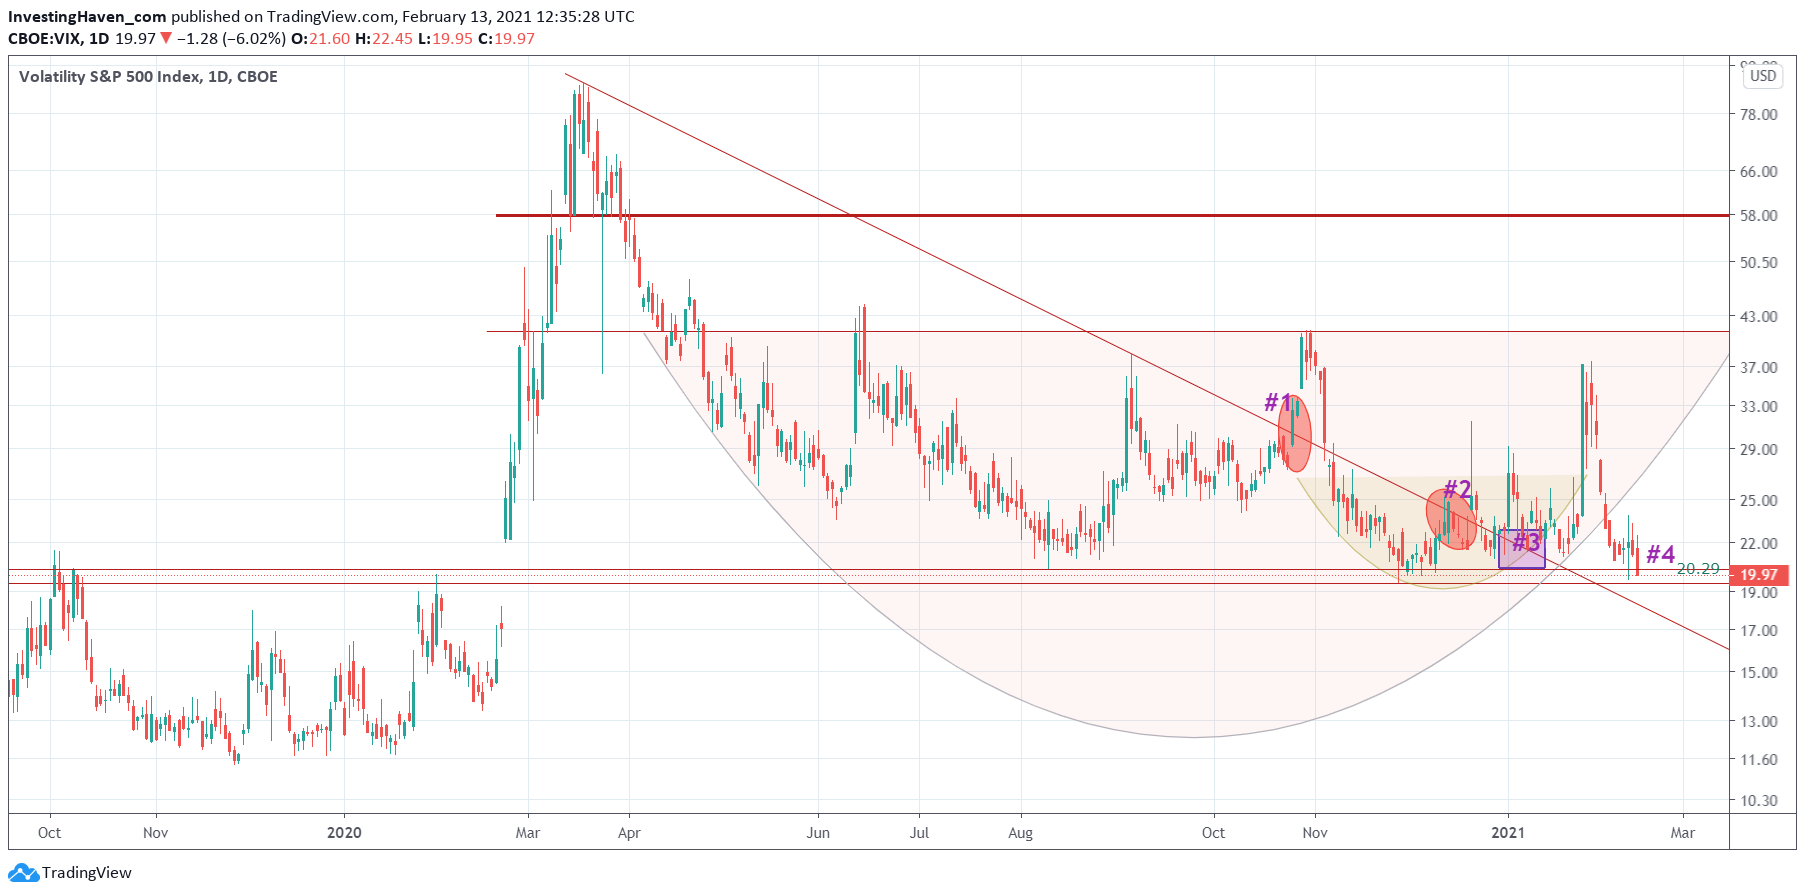
VIX, able to predict volatility and market sell offs right before it happens, started a breakdown on Friday evening. If VIX will fall below 20 points for 3 to 5 consecutive days we have a game changer: the Corona crash cycle will be complete, and will only live in history books going forward (not any longer in this market).
Look at the 20.29 red horizontal line: VIX started falling below this level one hour before the close of Friday’s session. Look left, this was the level that marked the start of the historic and epic sell off with a major ‘gap up’ on February 24th, 2020.
A confirmed break below 20.29 is absolutely a game changer, and exceptionally bullish for stocks going forward!