Credit markets have directionally predictive information about stock markets. In a way, credit markets are able to predict (directionally) stocks because of intermarket dynamics, i.e. capital flows. If anything credit markets arrived at a point which suggest that the next market cycle(s) this year will be very challenging to understand the exact trends they will bring. It will get challenging from here, this is why.
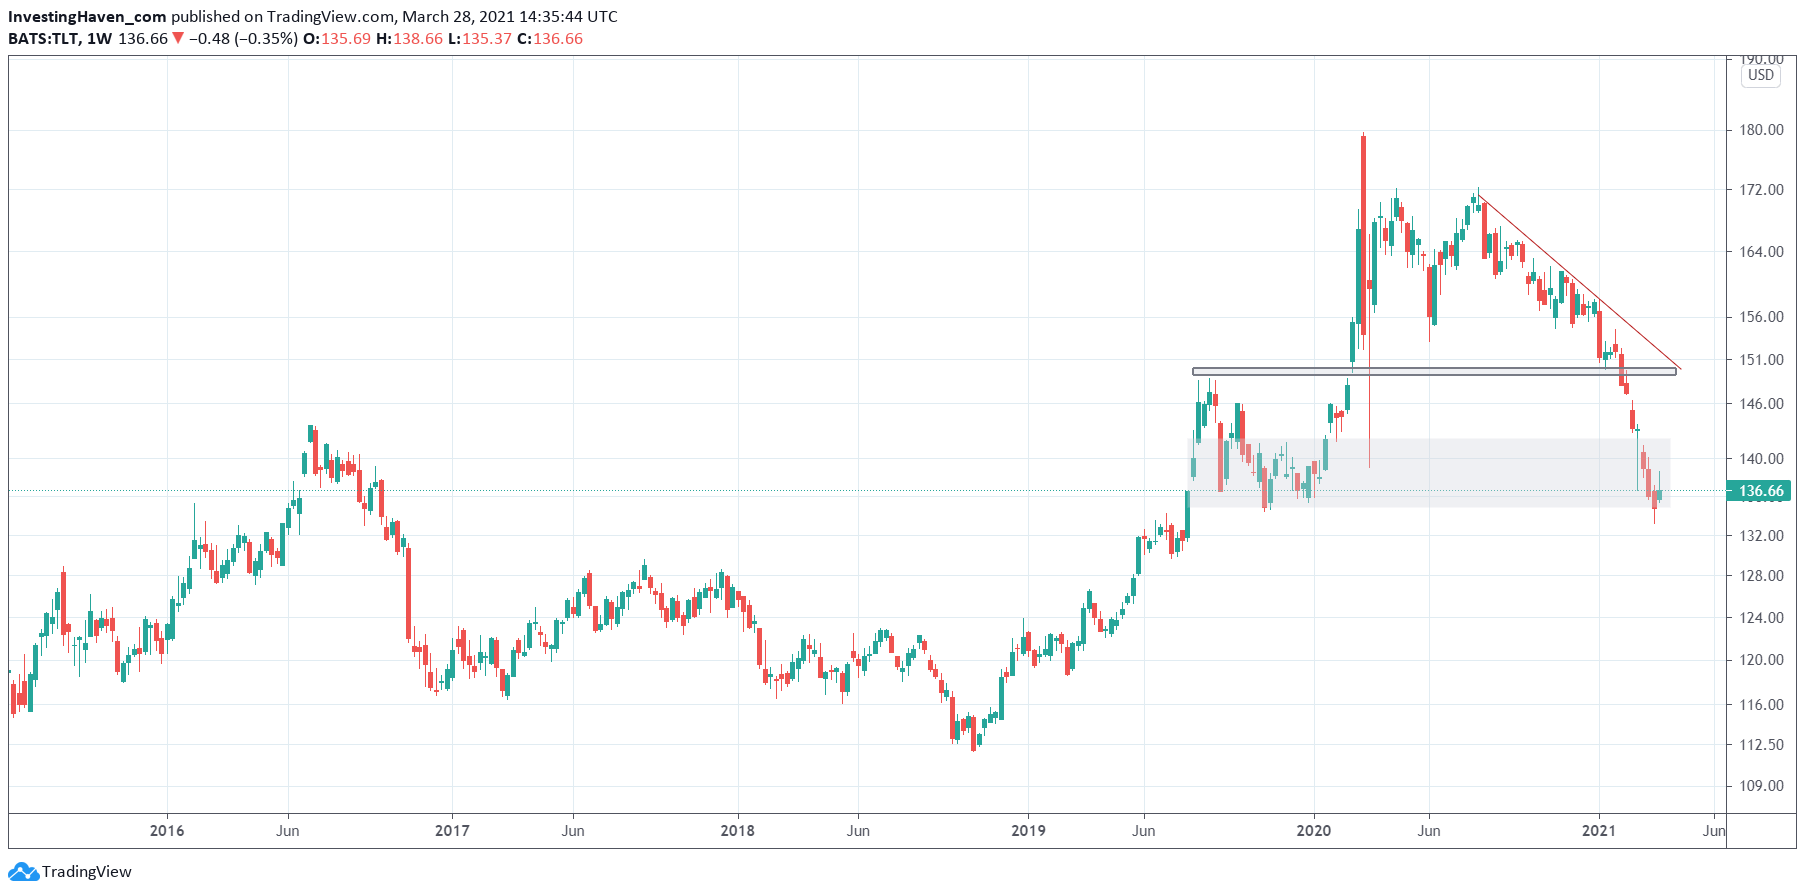
The one chart we feature in this article is TLT ETF, a proxy for 20 year Treasuries.
The structure of the chart, and with this the ongoing and future trend(s) help understand future trends in stocks.
The way to read the TLT chart (weekly timeframe, our annotations):
- A violent decline in the last 2 months created momentum in many stock market sectors.
- Even in March of 2021 which broke many trends in stock market sectors TLT continued to move lower (outflow of Treasuries suggests inflow into other assets, either stocks and/or currencies like USD which suggests investors move into cash).
- Going forward, we see that TLT is now trading at solid support levels. The structure in grey, back in 2019, created good support. TLT is likely going to start a consolidation from here.
What this means is that there will not be broad market trends, like in November (most stocks up). On the contrary, there will be only specific sectors that will do well.
We got a ‘teaser’ of this in the current market cycle. As per our cycle count the current cycle started on Jan 1st, 2021 and is coming to an end this week. It was a very tough cycle to read, and ‘in hindsight’ it was clear that this cycle was split in 2 parts: the first 6 weeks were about momentum-to-the-moon, and the next 6 weeks were about ‘momentum implosion’. To make things harder to read, most sectors sold off, but only a few did hold up … however, they did not succeed in rising they only succeeded in not crashing.


