Recent market turmoil has hit global markets without any exception. Is this the start of a 2008-alike crash or this is the end of a normal and healthy short term correction? This one chart will largely determine what comes next.
Smart investors monitor closely what happens in currency and credit markets. That’s where the real problems always start, readers can go back to the 2000 dotcom crisis, 2008 housing crisis, 2011 Euro crisis, 2015 crude oil crash, and so on.
By far the most important leading indicator when it comes to currency and credit markets is the Euro. The Euro chart has consistently shown traces of big movements starting in global markets. This time will not be any different.
What exactly to monitor? The point is about the chart structures, and any breakout or breakdown out of dominant patterns.
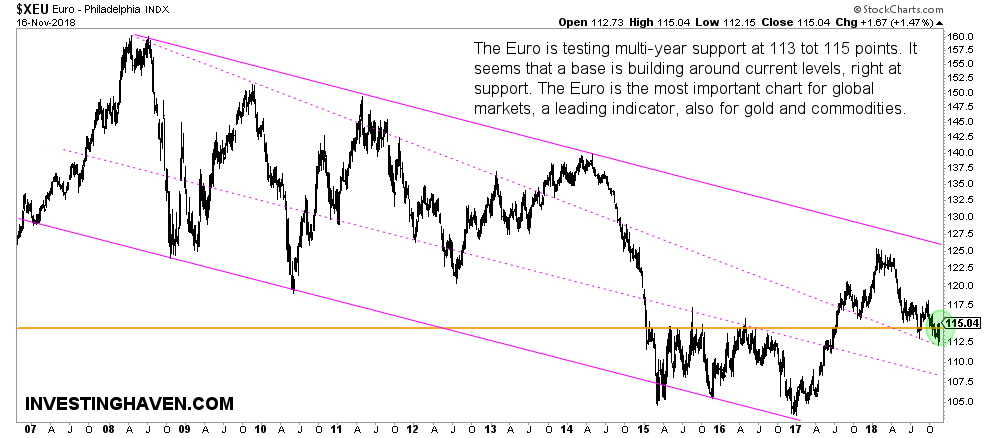
Take for instance any test or resistance and support in its multi-decade channel shown below. Those turning points have mostly major impact, for sure once an acceleration after such a test takes place.
Similarly, any test of critical levels like former horizontal resistance or support. The 117 point level is a good example.
Right now, the Euro chart shows that it has hit one such critical points. The 115 point level (orange line) is former resistance. Moreover, it also coincides with a support level in a falling channel (dotted lines).
This tells us that the 112 to 114 level has an above average value. You better pay attention to this!
What happens around current levels will largely determine what’s next in global markets. If the Euro stabilizes right here it would remove volatility most likely. If the Euro starts rising (fast) it will be very supportive for commodities and likely for stocks as well. However, if the Euro falls below support, pretty fast, it will bring much more selling in stocks and commodities.
Investors better pay attention to this one chart!


