A few weeks ago we wrote that VIX + USD Was An Ugly Cocktail For Markets In September. We got a few really rocky weeks in September, some specific sectors got hit hard. At this very point in time both VIX and the USD are at make-or-break levels. Whatever happens next week in both markets will define the stock market direction for the remainder of October!
Both the USD and VIX are leading indicators, however they work on a different timeframe and have different types of intermarket effects.
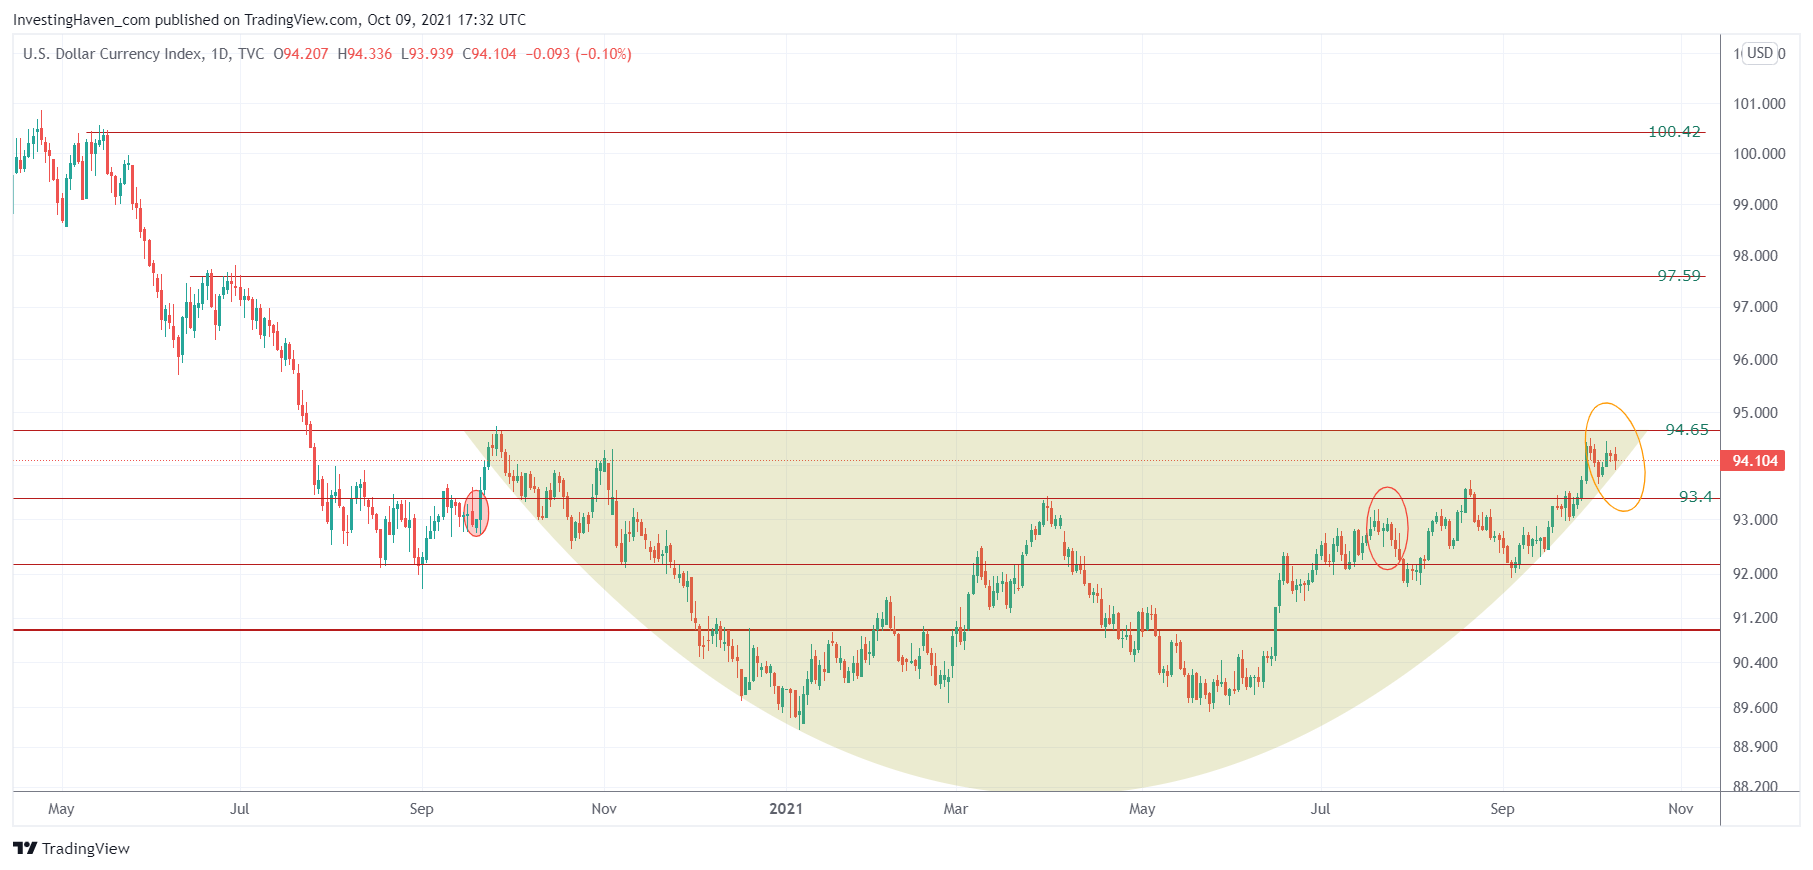
The USD chart is wildly bullish, let’s be very clear. However, the very important 94.65 level might not be taken out immediately. Whatever happens in the next few days (yellow circle) will be telling. Even though USD price changes do not tend to have immediate effects on stock indexes we would think that a break above 94.65 would have a pretty powerful and instant effect on stock markets.
The VIX index has a very short term effect on the S&P 500.
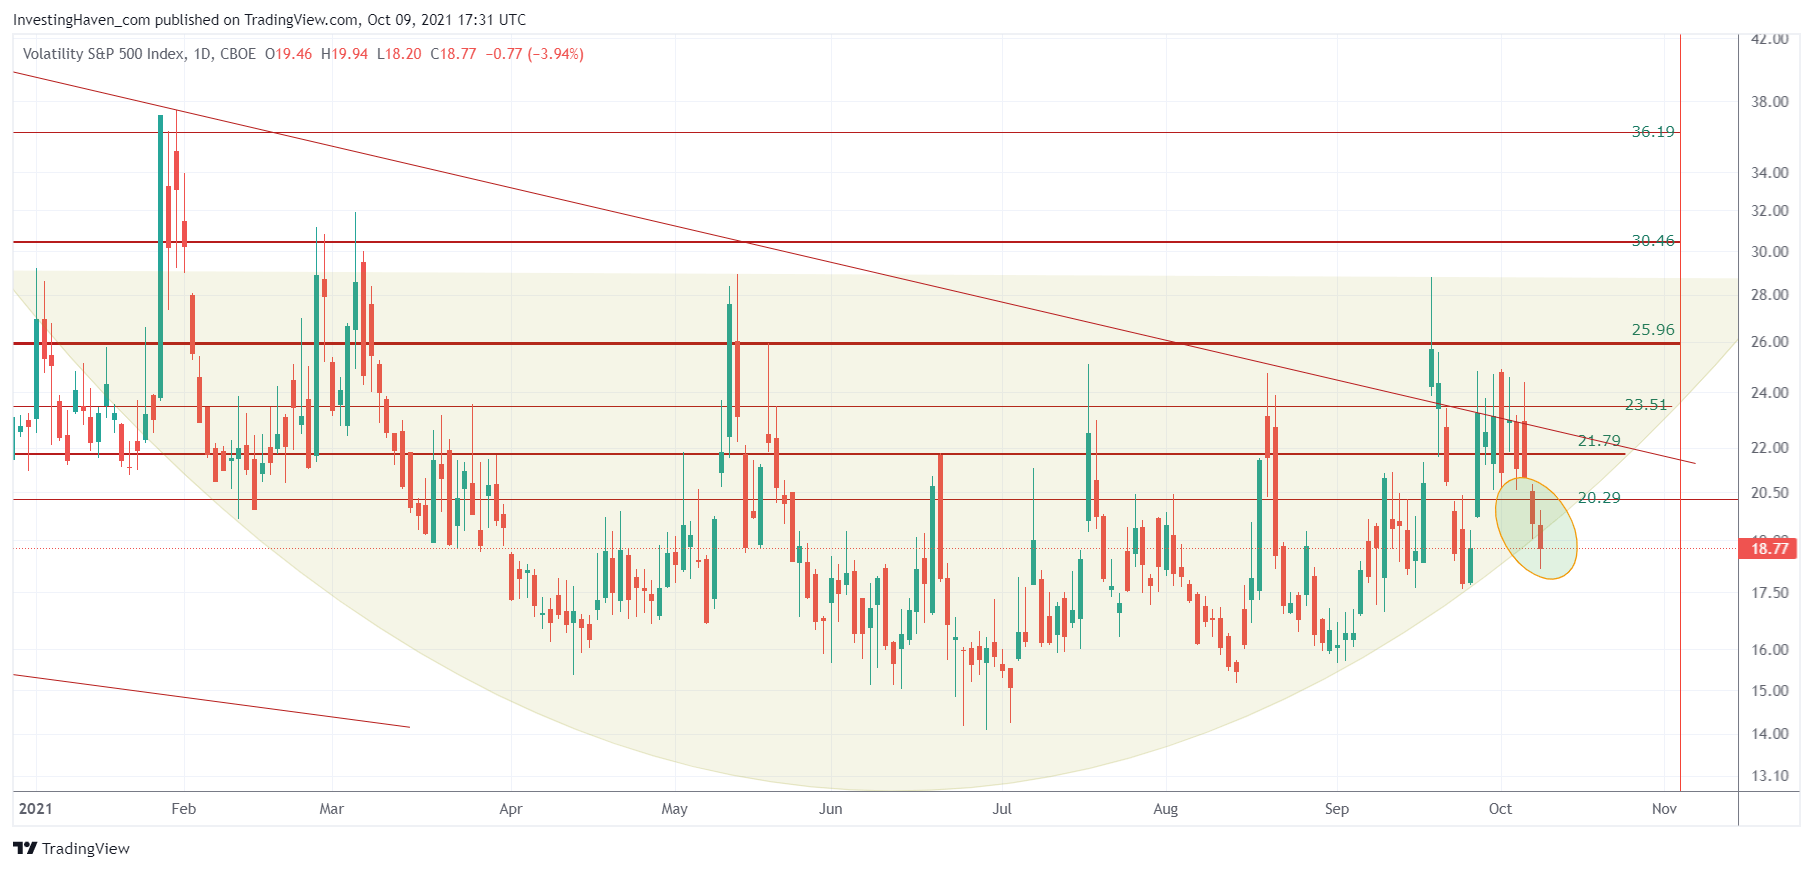
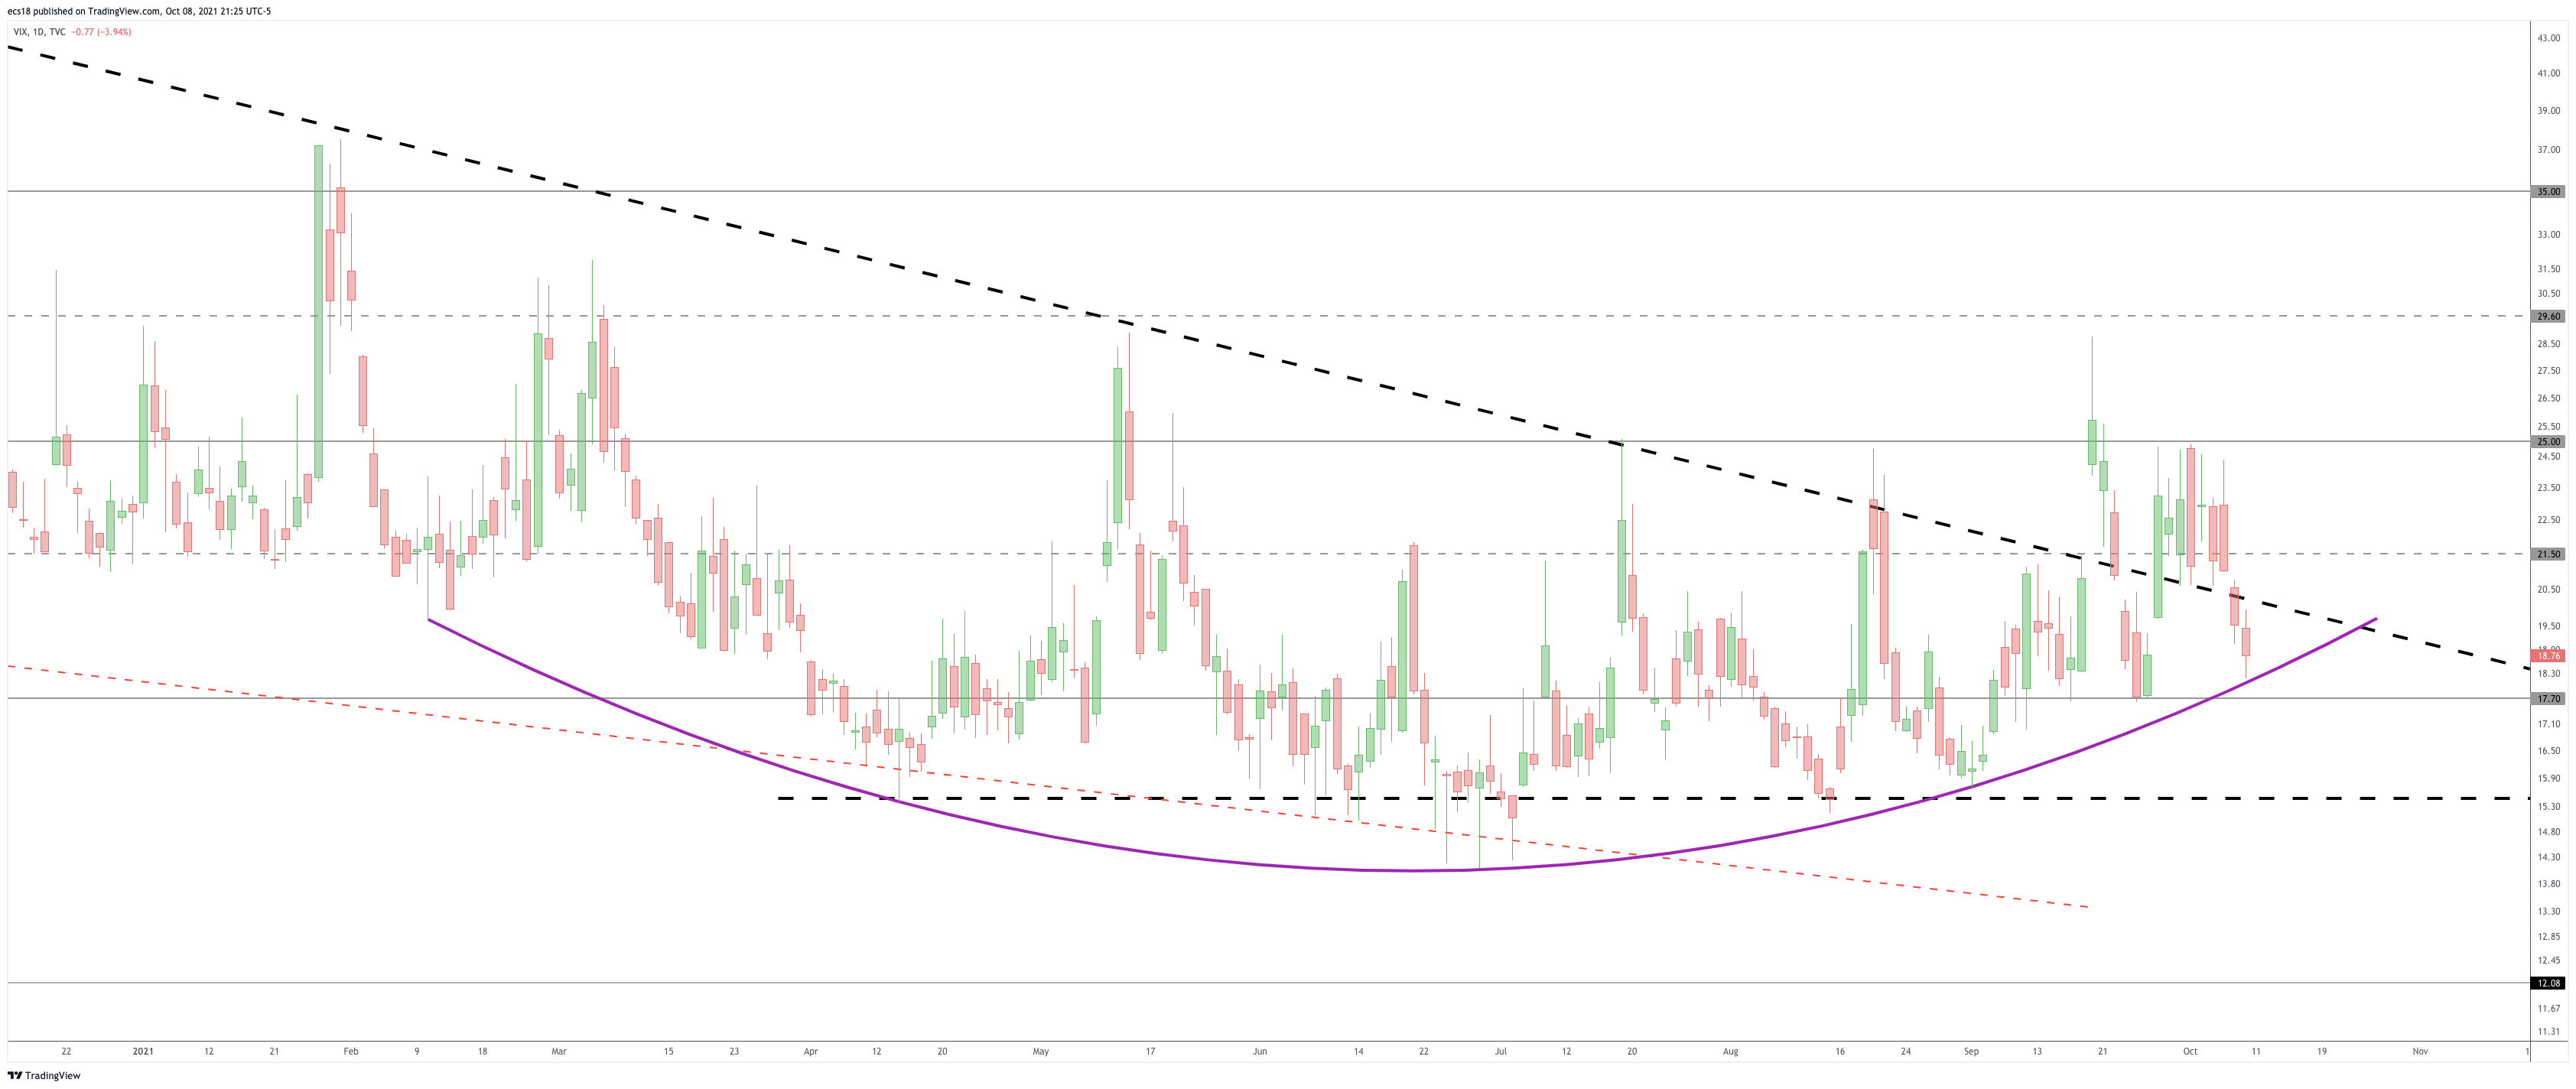
We found an interesting divergence on the VIX chart.
One VIX chart suggests that the bullish reversal (bearish for stocks) that is in the making for 7 full months did invalidate on Friday.
Our other chart suggests the reversal is still valid, consequently the bearish case for stocks is still valid.
We believe that the coming trading week will be crucial for markets, and both the VIX + USD will bring clarity.
In both our premium services (short term trading and medium term investing) we act accordingly. Our in-depth weeken


